Quantcast
Channel: Search Results for “quantmod”– R-bloggers
Viewing all 170 articles
Browse latest View live

2013 Summary

$
0
0

(This article was first published on Quintuitive » R, and kindly contributed to R-bloggers)

2013 was a tough year. Trading was tough, with one of my strategies experiencing a significant drawdown. Research was tough – wasted a lot of time on machine learing techneques, without much to show for it. Also made some expensive mistakes, so all in all – it was a year I’d prefer I had avoided. :)

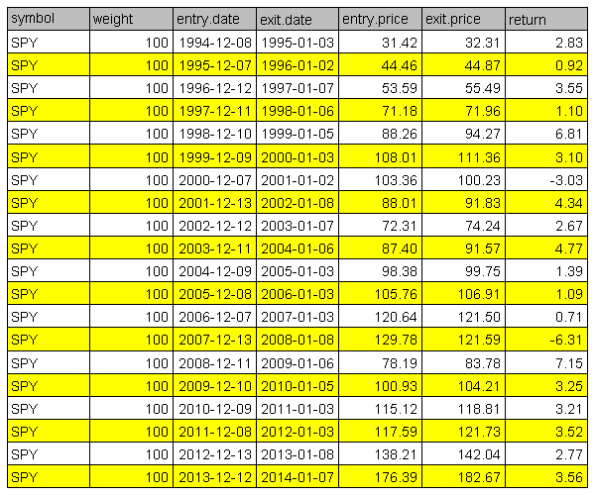
The strategy I use on the SPY, for which I share my entries and exits, was the biggest disappointment. Not only it ended the year in red (to the tune of -6.5%), but it also dragged me through a significant (close to its historical maximum) drawdown. This unpleasant experience was a practical conformation of the toughness of trading at psychological level.

My ARMA strategy performed well, but not exceptionally so, thus, I ended up with an overall gain of about 5% in my trading account (the SPY strategy and the ARMA strategy).

The Max-Sharpe strategy which I started using in May this year returned 12% for the year. However, that’s exactly where I did my “expensive” mistake, thus, I ended only with a small plus for the months I traded it.

At the end of the year, I like to look at the annual volatility. As the following chart illustrates, 2013 was a year of low volatility on historic basis:

Dow Jones Annual Volatility

Dow Jones Annual Volatility

The following code confirms:

library(quantmod)
 
getSymbols("DJIA", src="FRED", from="1800-01-01")
# Use FRED, Yahoo does not provide Dow Jones historic data anymore
 
dji = na.exclude(DJIA["/2013"])
 
djiVol = aggregate(
               dji,
               as.numeric(format(index(dji), "%Y")),
               function(ss) coredata(tail(TTR:::volatility(
                                                   ss,
                                                   n=NROW(ss),
                                                   calc="close"), 1)))
ecdf(as.vector(djiVol))(as.numeric(tail(djiVol,1)))
# The result is 0.1864407, the 18nd quantile

# Compute the absolute returns
absRets = na.exclude(abs(ROC(dji["/2013"], type="discrete")))
 
# Summarize annually
yy = as.numeric(format(index(absRets), "%Y"))
zz = aggregate(absRets, yy, function(ss) tail(cumprod(1+ss),1))
 
print(as.vector(tail(zz,1)))
# The result is 3.45

The second computation shows how much money an owner of a crystal bowl would have made at best – he would have been able to multiply his money less than three and a half times! As crystal balls go, that’s an inferior performance.

The only significant change I am hoping for in 2014 – is a change in the luck factor. Let’s see whether I was good in 2013 … Happy Trading! :)

To leave a comment for the author, please follow the link and comment on his blog: Quintuitive » R.

R-bloggers.com offers daily e-mail updates about R news and tutorials on topics such as: visualization (ggplot2, Boxplots, maps, animation), programming (RStudio, Sweave, LaTeX, SQL, Eclipse, git, hadoop, Web Scraping) statistics (regression, PCA, time series, trading) and more...

Quantitative Finance Applications in R – 2

$
0
0

(This article was first published on Revolutions, and kindly contributed to R-bloggers)

by Daniel Hanson 
QA Data Scientist, Revolution Analytics

Some Applications of the xts Time Series Package

In our previous discussion, we looked at accessing financial data using the quantmod and Quandl R packages.  As noted there, the data series returned by quantmod comes in the form of an xts time series object, and Quandl provides a parameter that sets the return object of type xts.  As the xts R package comes included with the quantmod package, it is not necessary to reload it as long as quantmod has been loaded.

In this article, we will look at some of the useful features in xts, by way of data retrieved from quantmod.  We will also need to load one more package: moments.  The moments package computes skewness and kurtosis of data, as these calculations are somewhat surprisingly not included in base R. With that said, we run the following library commands so that we’ll be ready to go:

library(quantmod)
library(xts)
library(moments)  # to get skew & kurtosis

Now, let’s download the last 10 years of daily prices for the SPDR S&P 500 ETF (SPY).  

getSymbols("SPY", src="google", from = "2004-01-01")

Remark: the from parameter in getSymbols is not described in the help file for the getSymbols function; a reader of our previous post was kind enough to provide this information.

As before, the return object from getSymbols is assigned the name of the ticker symbol, in this case SPY.  Let’s look at this in more detail.  First, we can verify that it is an xts object:

is.xts(SPY) # returns TRUE

Next, we can have a quick look at the data using head(SPY) and tail(SPY), just as we would for an R dataframe.  These return, respectively:

           SPY.Open SPY.High SPY.Low SPY.Close SPY.Volume
2004-01-02   111.85   112.19  110.04    111.23   34487200
2004-01-05   111.61   112.52  111.59    112.44   27160100
2004-01-06   112.25   112.73  112.00    112.55   19282500
2004-01-07   112.43   113.06  111.89    112.93   28340200
2004-01-08   112.90   113.48  112.77    113.38   34295500
2004-01-09   113.35   113.50  112.27    112.39   41431900
 
 
           SPY.Open SPY.High SPY.Low SPY.Close SPY.Volume
2013-12-26   183.34   183.96  183.32    183.86   63365227
2013-12-27   184.10   184.18  183.66    183.84   61813841
2013-12-30   183.87   184.02  183.58    183.82   56857458
2013-12-31   184.07   184.69  183.93    184.69   86247638
2014-01-02   183.98   184.07  182.48    182.92  119636836
2014-01-03   183.21   183.60  182.63    182.88   81390502

We will, in fact, see that xts objects can typically be treated just like dataframes in a number of other cases.  To wit, if we just wanted the closing prices for the series, we can extract them in the usual way:

SPY.Close <- SPY[, "SPY.Close"]

Then, note that this subset is also an xts object:

is.xts(SPY.Close) # returns TRUE

We will use this series of closing prices later when we look at plotting.

By now, you may be asking:  if xts objects can be treated like dataframes, what’s the big deal?  Well, the main difference is that, being indexed by date, we have a convenient tool at our disposal.  For example, suppose we wanted to take the subset of prices from January 2006 through December 2007. This is easily done by entering the command

x1 <- SPY['2006-01/2007-12'] # store the output in x1, etc

Note that the index setting is of the form ‘from /to’, with date format YYYY-MM.  The output is stored in a new xts object called, say, x1.  In a similar fashion, if we wanted all the prices from the beginning of the set through, say, the end of July 2005, we would enter:

x2 <- SPY['/2005-07']

We can also store all the prices from a particular year, say 2010, or a particular month of the year, say December 2010, as follows (respectively):

x3 <- SPY['2010']
x4 <- SPY['2010-12']

Next, suppose we wish to extract monthly or quarterly data for 2010.  There are a couple of ways to do this.  First, one can use the commands:

x5 <- to.period(SPY['2010'], 'months')
x6 <- to.period(SPY['2010'], 'quarters')

These will give the prices on the last day of each month and quarter, respectively, as shown here:

           SPY["2010"].Open SPY["2010"].High SPY["2010"].Low SPY["2010"].Close SPY["2010"].Volume
2010-01-29           112.37           115.14          107.22            107.39         3494623433
2010-02-26           108.15           111.58          104.58            110.74         4147289073
2010-03-31           111.20           118.17          111.17            117.00         3899883233
2010-04-30           118.25           122.12          117.60            118.81         3849880548
2010-05-27           119.38           120.68          104.38            110.76         7116214265
(etc)
 
           SPY["2010"].Open SPY["2010"].High SPY["2010"].Low SPY["2010"].Close SPY["2010"].Volume
2010-03-31           112.37           118.17          104.58            117.00        11541795739
2010-06-30           118.25           122.12          102.88            103.22        16672606329
2010-09-30           103.15           115.79          101.13            114.13        12867300420
2010-12-31           114.99           126.20          113.18            125.75        10264947894

Alternatively, we can use the following commands to get the same data:

x7 <- to.monthly(SPY['2010'])
x8 <- to.quarterly(SPY['2010'])

The only difference is that instead of the actual end-of-month dates being shown, we get MMM YYYY and YYYY QQ formats in the left column, rather than the actual dates:

       SPY["2010"].Open SPY["2010"].High SPY["2010"].Low SPY["2010"].Close SPY["2010"].Volume
Jan 2010           112.37           115.14          107.22            107.39         3494623433
Feb 2010           108.15           111.58          104.58            110.74         4147289073
Mar 2010           111.20           118.17          111.17            117.00         3899883233
Apr 2010           118.25           122.12          117.60            118.81         3849880548
May 2010           119.38           120.68          104.38            110.76         7116214265
(etc)
 
       SPY["2010"].Open SPY["2010"].High SPY["2010"].Low SPY["2010"].Close SPY["2010"].Volume
2010 Q1           112.37           118.17          104.58            117.00        11541795739
2010 Q2           118.25           122.12          102.88            103.22        16672606329
2010 Q3           103.15           115.79          101.13            114.13        12867300420
2010 Q4           114.99           126.20          113.18            125.75        10264947894

To close things out, let’s go back to the column of closing prices that we extracted above.  As noted, the object SPY.Close is also an xts object.  Taking a look at the top of this data using

head(SPY.Close)

we get:

            SPY.Close
2004-01-02    111.23
2004-01-05    112.44
2004-01-06    112.55
2004-01-07    112.93
2004-01-08    113.38
2004-01-09    112.39

We can also use the subsetting features such as:

SPY.Close['2006-01/2007-12']
SPY.Close['/2005-07']
SPY.Close['2010']
SPY.Close['2010-12']

as we did for the full SPY set.  What we apparently cannot do, however, is extract monthly or quarterly data from SPY.Close using the to.period(.), to.monthly(.) or to.quarterly(.) command.  One gets unexpected behavior where all columns of the original SPY set are returned, rather than just the desired subsets of the SPY.Close prices.  The reason for this does not seem to be provided in the xts documentation or vignette.

Getting back to the task at hand, we can plot the SPY.Close series in a fashion similar to plotting a vector of data using the plot(.) command.  We can use the same parameters to indicate the x and y axis labels, a title, and the color of the graph.  In addition, we can make our plot look nicer by using parameters specific to xts objects.  For example, let’s look at the following plot(.) command:

plot(SPY.Close, main = "Closing Daily Prices for SP 500 Index ETF (SPY)",
     col = "red",xlab = "Date", ylab = "Price", major.ticks='years',
     minor.ticks=FALSE)

The parameters main, col, xlab, and ylab are the same as those used in base R plot(.).  The parameters major.ticks and minor.ticks are specific to xts; the former will display years along the x-axis, while setting the latter to FALSE, suffice it to say for now, avoids a gray bar along the x-axis.

Our graph then looks like this:

 QF1

We can also calculate daily log returns

SPY.ret <- diff(log(SPY.Close), lag = 1)
SPY.ret <- SPY.ret[-1] # Remove resulting NA in the 1st position

and then plot these using the same command, but with the return data:

plot(SPY.ret, main = "Closing Daily Prices for SP 500 Index ETF (SPY)",
      col = "red", 
xlab = "Date", ylab = "Return", major.ticks='years',
      minor.ticks=FALSE)

QF2

Interestingly, we can see the spike in the volatility of returns during the financial crisis of 2008-2009.

Finally, we can calculate summary statistics of the time series of returns, namely the mean return, volatility (standard deviation), skewness, and kurtosis:

statNames <- c("mean", "std dev", "skewness", "kurtosis")
SPY.stats <- c(mean(SPY.ret), sd(SPY.ret), skewness(SPY.ret), kurtosis(SPY.ret))
names(SPY.stats) <- statNames
SPY.stats

which gives us:

        mean       std dev      skewness      kurtosis
0.0001952538  0.0127824204 -0.0805232066 17.3271959064

The above hopefully provides a useful introduction to the xts package for use with financial market data.  The plot examples given are admittedly rudimentary, and other packages, including quantmod, provide more sophisticated features that result in a more palatable presentation, as well as more useful information, such as plots of overlayed time series.  We will look at more advanced graphics in an upcoming article.


To leave a comment for the author, please follow the link and comment on his blog: Revolutions.

R-bloggers.com offers daily e-mail updates about R news and tutorials on topics such as: visualization (ggplot2, Boxplots, maps, animation), programming (RStudio, Sweave, LaTeX, SQL, Eclipse, git, hadoop, Web Scraping) statistics (regression, PCA, time series, trading) and more...

Overnight vs. Intraday ETF Returns

$
0
0

(This article was first published on The R Trader » R, and kindly contributed to R-bloggers)

I haven’t done much “googling” before posting, so this topic might have been covered elsewhere but I think it’s  really worth sharing or repeating anyway.

A lot has been written about the source of  ETF returns (some insights might be found here). In a nutshell some analysis found that the bulk of the return is made overnight (return between close price at t and open price at t+1). This is only partially true as it hides some major differences across asset classes and regions. The table below displays the sum of daily returns (close to close) , intraday returns (open to close) and overnight returns (close to open) for most liquid ETF over a period going from today back to January 1st 2000 when data is available. The inception date of the ETF is used when no data is available prior to January 1st 2000.

ETF Daily Rtn Intraday Rtn Overnight Rtn
SPY 53.7% -8.1% 59.2%
QQQ 10.7% -84.3% 93.3%
IWN 81.8% 30.4% 52.1%
EEM 51.5% -42.5% 83.8%
EFA 13.2% 73.3% -61.5%
EWG 77.7% 143.1% -62.6%
EWU 41.2% 132.3% -84.5%
EWL 109.4% 229.9% -110.3%
EWJ 10.4% 115% -107.9%
FXI 72.8% 13.8% 45.3%
EWS 89.7% -83.9% 175.9%
GLD 120.9% 18.7% 101.1%
GDX 29% -270.2% 293.5%
SLV -2.8% -36.6% 39.1%
USO -21.6% 56.7% -79.5%
SHY 4% 10.7% -6.5%
IEF 23.5% 37.4% -13.4%
TLT 37.1% 50.6% -13.5%
LQD 16.7% -36.3% 54.3%

A few obvious features clearly appear

  • For US Equity markets (SPY, QQQ, IWM), Emerging Equity Markets (EEM), Metals (GLD,GDX,SLV) and Investment Grades (LQD) the bulk of the return is definitely made overnight. Intraday returns tend to deteriorate the overall performance (intraday return < 0)
  • The exact opposite is true for European Equity Markets (EFA,EWG,EWU,EWL), US Bonds (SHY,IEF,TLT) and Oil (USO). Overnight returns are detracting significantly from the overall performance.

I didn’t manage to come up with a decent explanation about why this is happening but I’m keen on learning if someone is willing to share! I’m not too sure at this stage how this information can be used but it has to be taken into account somehow.

Below is the code for generating the analysis above.

####################################################
## OVERNIGHT RETURN IN ETF PRICES
##
## thertrader@gmail.com - Jan 2014
####################################################
library(quantmod)

symbolList <- c("SPY","QQQ","IWN","EEM","EFA","EWG","EWU","EWL","EWJ","FXI","EWS","GLD","GDX","SLV","USO","SHY","IEF","TLT","LQD")

results <- NULL

for (ii in symbolList){
  data <- getSymbols(Symbols = ii, 
                     src = "yahoo", 
                     from = "2000-01-01", 
                     auto.assign = FALSE)

  colnames(data) <- c("open","high","low","close","volume","adj.")

  dailyRtn <- (as.numeric(data[2:nrow(data),"close"])/as.numeric(data[1:(nrow(data)-1),"close"])) - 1
  intradayRtn <- (as.numeric(data[,"close"])/as.numeric(data[,"open"]))-1
  overnightRtn <- (as.numeric(data[2:nrow(data),"open"])/as.numeric(data[1:(nrow(data)-1),"close"])) - 1

  results <- rbind(results,cbind(
    paste(round(100 * sum(dailyRtn,na.rm=TRUE),1),"%",sep=""),
    paste(round(100 * sum(intradayRtn,na.rm=TRUE),1),"%",sep=""),
    paste(round(100 * sum(overnightRtn,na.rm=TRUE),1),"%",sep="")))
} 
colnames(results) <- c("dailyRtn","intradayRtn","overnightRtn")
rownames(results) <- symbolList

As usual any comments welcome

To leave a comment for the author, please follow the link and comment on his blog: The R Trader » R.

R-bloggers.com offers daily e-mail updates about R news and tutorials on topics such as: visualization (ggplot2, Boxplots, maps, animation), programming (RStudio, Sweave, LaTeX, SQL, Eclipse, git, hadoop, Web Scraping) statistics (regression, PCA, time series, trading) and more...

Quantitative Finance Applications in R – 3: Plotting xts Time Series

$
0
0

(This article was first published on Revolutions, and kindly contributed to R-bloggers)

by Daniel Hanson, QA Data Scientist, Revolution Analytics

Introduction and Data Setup

Last time, we included a couple of examples of plotting a single xts time series using the plot(.) function (ie, said function included in the xts package).  Today, we’ll look at some quick and easy methods for plotting overlays of multiple xts time series in a single graph.  As this information is not explicitly covered in the examples provided with xts and base R, this discussion may save you a bit of time.

To start, let’s look at five sets of cumulative returns for the following ETF’s:

SPY SPDR S&P 500 ETF Trust
QQQ PowerShares NASDAQ QQQ Trust
GDX Market Vectors Gold Miners ETF
DBO PowerShares DB Oil Fund (ETF)
VWO Vanguard FTSE Emerging Markets ETF

We first obtain the data using quantmod, going back to January 2007:

library(quantmod)
tckrs <- c("SPY", "QQQ", "GDX", "DBO", "VWO")
getSymbols(tckrs, from = "2007-01-01")

Then, extract just the closing prices from each set:

SPY.Close <- SPY[,4]
QQQ.Close <- QQQ[,4]
GDX.Close <- GDX[,4]
DBO.Close <- DBO[,4]
VWO.Close <- VWO[,4]

What we want is the set of cumulative returns for each, in the sense of the cumulative value of $1 over time.  To do this, it is simply a case of dividing each daily price in the series by the price on the first day of the series.  As SPY.Close[1], for example, is itself an xts object, we need to coerce it to numeric in order to carry out the division:

SPY1 <- as.numeric(SPY.Close[1])
QQQ1 <- as.numeric(QQQ.Close[1])
GDX1 <- as.numeric(GDX.Close[1])
DBO1 <- as.numeric(DBO.Close[1])
VWO1 <- as.numeric(VWO.Close[1])

Then, it’s a case of dividing each series by the price on the first day, just as one would divide an R vector by a scalar.  For convenience of notation, we’ll just save these results back into the original ETF ticker names and overwrite the original objects:

SPY <- SPY.Close/SPY1
QQQ <- QQQ.Close/QQQ1
GDX <- GDX.Close/GDX1
DBO <- DBO.Close/DBO1
VWO <- VWO.Close/VWO1

We then merge all of these xts time series into a single xts object (à la a matrix):

basket <- cbind(SPY, QQQ, GDX, DBO, VWO)

Note that is.xts(basket)returns TRUE. We can also have a look at the data and its structure:

> head(basket)
           SPY.Close QQQ.Close GDX.Close DBO.Close VWO.Close
2007-01-03 1.0000000  1.000000 1.0000000        NA 1.0000000
2007-01-04 1.0021221  1.018964 0.9815249        NA 0.9890886
2007-01-05 0.9941289  1.014107 0.9682540 1.0000000 0.9614891
2007-01-08 0.9987267  1.014801 0.9705959 1.0024722 0.9720154
2007-01-09 0.9978779  1.019889 0.9640906 0.9929955 0.9487805
2007-01-10 1.0012025  1.031915 0.9526412 0.9517923 0.9460847

> tail(basket)
           SPY.Close QQQ.Close GDX.Close DBO.Close VWO.Close
2014-01-10  1.302539        NA 0.5727296  1.082406 0.5118100
2014-01-13  1.285209  1.989130 0.5893833  1.068809 0.5053915
2014-01-14  1.299215  2.027058 0.5750716  1.074166 0.5110398
2014-01-15  1.306218  2.043710 0.5826177  1.092707 0.5109114
2014-01-16  1.304520  2.043941 0.5886027  1.089411 0.5080873
2014-01-17  1.299003  2.032377 0.6070778  1.090647 0.5062901

Note that we have a few NA values here.  This will not be of any significant consequence for demonstrating plotting functions, however.

We will now look how we can plot all five series, overlayed on a single graph.  In particular, we will look at the plot(.) functions in both the zoo and xts packages.

Using plot(.) in the zoo package

The xts package is an extension of the zoo package, so coercing our xts object basket to a zoo object is a simple task:

 zoo.basket <- as.zoo(basket)

Looking at head(zoo.basket) and tail(zoo.basket), we will get output that looks the same as what we got for the original xts basket object, as shown above; the date to data mapping is preserved. The plot(.) function provided in zoo is very simple to use, as we can use the whole zoo.basket object as input, and the plot(.) function will overlay the time series and scale the vertical axis for us with the help of a single parameter setting, namely the screens parameter.

Let’s now look at the code and the resulting plot in the following example, and then explain what’s going on:

# Set a color scheme:
tsRainbow <- rainbow(ncol(zoo.basket))
# Plot the overlayed series
plot(x = zoo.basket, ylab = "Cumulative Return", main = "Cumulative Returns",
        col = tsRainbow, screens = 1)
# Set a legend in the upper left hand corner to match color to return series
legend(x = "topleft", legend = c("SPY", "QQQ", "GDX", "DBO", "VWO"),
       lty = 1,col = tsRainbow)

  DH-TS-1

We started by setting a color scheme, using the rainbow(.) command that is included in the base R installation.  It is convenient as R will take in an arbitrary positive integer value and select a sequence of distinct colors up to the number specified.  This is a nice feature for the impatient or lazy among us (yes, guilty as charged) who don’t want to be bothered with picking out colors and just want to see the result right away.

Next, in the plot(.) command, we assign to x our “matrix” of time series in the zoo.basket object, labels for the horizontal and vertical axes (xlab, ylab), a title for the graph (main), the the colors (col). Last, but crucial, is the parameter setting screens = 1, which tells the plot command to overlay each series in a single graph.

Finally, we include the legend(.) command to place a color legend at the upper left hand corner of the graph.  The position (x) may be chosen from the list of keywords "bottomright", "bottom", "bottomleft", "left", "topleft", "top", "topright", "right" and "center"; in our case, we chose "topleft".  The legend parameter is simply the list of ticker names.  The lty parameter refers to “line type”, and by setting it to 1, the lines in the legend are shown as solid lines, and as in the plot(.) function, the same color scheme is assigned to the parameter col.

Back to the color scheme, we may at some point need to show our results to a manager or a client, so in that case, we probably will want to choose colors that are easier on the eye.  In this case, one can just store the colors into a vector, and then use it as an input parameter.  For example, set

myColors <- c("red", "darkgreen", "goldenrod", "darkblue", "darkviolet")

Then, just replace col = tsRainbow with col = myColors in the plot and legend commands:

plot(x = zoo.basket, xlab = "Time", ylab = "Cumulative Return",
        main = "Cumulative Returns", col = myColors, screens = 1)
legend(x = "topleft", legend = c("SPY", "QQQ", "GDX", "DBO", "VWO"),
       lty = 1, 
col = myColors)

We then get a plot that looks like this:

  DH-TS-2

Using plot(.) in the xts package

While the plot(.) function in zoo gave us a quick and convenient way of plotting multiple time series, it didn’t give us much control over the scale used along the horizontal axis.  Using plot(.) in xts remedies this; however, it involves doing more work.  In particular, we can no longer input the entire “matrix” object; we must add each series separately in order to layer the plots.  We also need to specify the scale along the vertical axis, as in the xts case, the function will not do this on the fly as it did for us in the zoo case.

We will use individual columns from our original xts object, basket.  By using basket rather than basket.zoo, this tells R to use the xts version of the function rather than the zoo version (à la an overloaded function in traditional object oriented programming).  Let’s again look at an example and the resulting plot, and then discuss how it works:

plot(x = basket[,"SPY.Close"], xlab = "Time", ylab = "Cumulative Return",
main = "Cumulative Returns", ylim = c(0.0, 2.5), major.ticks= "years",
        minor.ticks = FALSE, col = "red")
lines(x = basket[,"QQQ.Close"], col = "darkgreen")
lines(x = basket[,"GDX.Close"], col = "goldenrod")
lines(x = basket[,"DBO.Close"], col = "darkblue")
lines(x = basket[,"VWO.Close"], col = "darkviolet")
legend(x = 'topleft', legend = c("SPY", "QQQ", "GDX", "DBO", "VWO"),
      lty = 1, col = myColors)

DH-TS-4

As mentioned, we need to add each time series separately in this case in order to get the desired overlays.  If one were to try x = basket in the plot function, the graph would only display the first series (SPY), and a warning message would be returned to the R session.  So, we first use the SPY series as input to the plot(.) function, and then add the remaining series with the lines(.) command.  The color for each series is also included at each step (the same colors in our myColors vector).

As for the remaining arguments in the plot command, we use the same axis and title settings in xlab, ylab, and main.  We set the scale of the vertical axis with the ylim parameter; noting from our previous example that VWO hovered near zero at the low end, and that DBO reached almost as high as 2.5, we set this range from 0.0 to 2.5.  Two new arguments here are the major.ticks and minor.ticks settings. The major.ticks argument represents the periods in which we wish to chop up the horizontal axis; it is chosen from the set

{"years", "months", "weeks", "days", "hours", "minutes", "seconds"}

In the example above, we chose "years".  The minor.ticks parameter can take values of TRUE/FALSE, and as we don’t need this for the graph, we choose FALSE.  The same legend command that we used in the zoo case can be used here as well (using myColors to indicate the color of each time series plot). Just to compare, let’s change the major.ticks parameter to "months" in the previous example. The result is as follows:

  DH-TS-3

Wrap-up

A new package, called xtsExtra, includes a new plot(.) function that provides added functionality, including a legend generator.  However, while it is available on R-Forge, it has not yet made it into the official CRAN repository.  More sophisticated time series plotting capability can also be found in the quantmod and ggplot2 packages, and we will look at the ggplot2 case in an upcoming post.  However, for plotting xts objects quickly and with minimal fuss, the plot(.) function in the zoo package fills the bill, and with a little more effort, we can refine the scale along the horizontal axis using the xts version of plot(.).  R help files for each of these can be found by selecting plot.zoo and plot.xts respectively in help searches.

To leave a comment for the author, please follow the link and comment on his blog: Revolutions.

R-bloggers.com offers daily e-mail updates about R news and tutorials on topics such as: visualization (ggplot2, Boxplots, maps, animation), programming (RStudio, Sweave, LaTeX, SQL, Eclipse, git, hadoop, Web Scraping) statistics (regression, PCA, time series, trading) and more...

Probabilistic Momentum

$
0
0

(This article was first published on Systematic Investor » R, and kindly contributed to R-bloggers)

David Varadi has recently discussed an interesting strategy in the
Are Simple Momentum Strategies Too Dumb? Introducing Probabilistic Momentum post. David also provided the Probabilistic Momentum Spreadsheet if you are interested in doing computations in Excel. Today I want to show how you can test such strategy using the Systematic Investor Toolbox:

###############################################################################
# Load Systematic Investor Toolbox (SIT)
# http://systematicinvestor.wordpress.com/systematic-investor-toolbox/
###############################################################################
setInternet2(TRUE)
con = gzcon(url('http://www.systematicportfolio.com/sit.gz', 'rb'))
    source(con)
close(con)
	#*****************************************************************
	# Load historical data
	#****************************************************************** 
	load.packages('quantmod')
		
	tickers = spl('SPY,TLT')
		
	data <- new.env()
	getSymbols(tickers, src = 'yahoo', from = '1980-01-01', env = data, auto.assign = T)
		for(i in ls(data)) data[[i]] = adjustOHLC(data[[i]], use.Adjusted=T)
	bt.prep(data, align='remove.na', dates='2005::')
 
	
	#*****************************************************************
	# Setup
	#****************************************************************** 
	lookback.len = 60
	
	prices = data$prices
	
	models = list()
	
	#*****************************************************************
	# Simple Momentum
	#****************************************************************** 
	momentum = prices / mlag(prices, lookback.len)
	data$weight[] = NA
		data$weight$SPY[] = momentum$SPY > momentum$TLT
		data$weight$TLT[] = momentum$SPY <= momentum$TLT
	models$Simple  = bt.run.share(data, clean.signal=T) 	

The Simple Momentum strategy invests into SPY if SPY’s momentum if greater than TLT’s momentum, and invests into TLT otherwise.

	#*****************************************************************
	# Probabilistic Momentum
	#****************************************************************** 
	confidence.level = 60/100
	ret = prices / mlag(prices) - 1 

	ir = sqrt(lookback.len) * runMean(ret$SPY - ret$TLT, lookback.len) / runSD(ret$SPY - ret$TLT, lookback.len)
	momentum.p = pt(ir, lookback.len - 1)
		
	data$weight[] = NA
		data$weight$SPY[] = iif(cross.up(momentum.p, confidence.level), 1, iif(cross.dn(momentum.p, (1 - confidence.level)), 0,NA))
		data$weight$TLT[] = iif(cross.dn(momentum.p, (1 - confidence.level)), 1, iif(cross.up(momentum.p, confidence.level), 0,NA))
	models$Probabilistic  = bt.run.share(data, clean.signal=T) 	

The Probabilistic Momentum strategy is using Probabilistic Momentum measure and Confidence Level to decide on allocation. Strategy invests into SPY if SPY vs TLT Probabilistic Momentum is above Confidence Level and invests into TLT is SPY vs TLT Probabilistic Momentum is below 1 – Confidence Level.

To make Strategy a bit more attractive, I added a version that can leverage SPY allocation by 50%

	#*****************************************************************
	# Probabilistic Momentum + SPY Leverage 
	#****************************************************************** 
	data$weight[] = NA
		data$weight$SPY[] = iif(cross.up(momentum.p, confidence.level), 1, iif(cross.up(momentum.p, (1 - confidence.level)), 0,NA))
		data$weight$TLT[] = iif(cross.dn(momentum.p, (1 - confidence.level)), 1, iif(cross.up(momentum.p, confidence.level), 0,NA))
	models$Probabilistic.Leverage = bt.run.share(data, clean.signal=T) 	

	#*****************************************************************
	# Create Report
	#******************************************************************    
	strategy.performance.snapshoot(models, T)

plot1

The back-test results look very similar to the ones reported in the Are Simple Momentum Strategies Too Dumb? Introducing Probabilistic Momentum post.

However, I was not able to exactly reproduce the transition plots. Looks like my interpretation is producing more whipsaw when desired.

	#*****************************************************************
	# Visualize Signal
	#******************************************************************        
	cols = spl('steelblue1,steelblue')
	prices = scale.one(data$prices)

	layout(1:3)
	
	plota(prices$SPY, type='l', ylim=range(prices), plotX=F, col=cols[1], lwd=2)
	plota.lines(prices$TLT, type='l', plotX=F, col=cols[2], lwd=2)
		plota.legend('SPY,TLT',cols,as.list(prices))

	highlight = models$Probabilistic$weight$SPY > 0
		plota.control$col.x.highlight = iif(highlight, cols[1], cols[2])
	plota(models$Probabilistic$equity, type='l', plotX=F, x.highlight = highlight | T)
		plota.legend('Probabilistic,SPY,TLT',c('black',cols))
				
	highlight = models$Simple$weight$SPY > 0
		plota.control$col.x.highlight = iif(highlight, cols[1], cols[2])
	plota(models$Simple$equity, type='l', plotX=T, x.highlight = highlight | T)
		plota.legend('Simple,SPY,TLT',c('black',cols))	

plot2

David thank you very much for sharing your great ideas. I would encourage readers to play with this strategy and report back.

To view the complete source code for this example, please have a look at the bt.probabilistic.momentum.test() function in bt.test.r at github.


To leave a comment for the author, please follow the link and comment on his blog: Systematic Investor » R.

R-bloggers.com offers daily e-mail updates about R news and tutorials on topics such as: visualization (ggplot2, Boxplots, maps, animation), programming (RStudio, Sweave, LaTeX, SQL, Eclipse, git, hadoop, Web Scraping) statistics (regression, PCA, time series, trading) and more...

Quantitative Finance Applications in R – 4: Using the Generalized Lambda Distribution to Simulate Market Returns

$
0
0

(This article was first published on Revolutions, and kindly contributed to R-bloggers)

by Daniel Hanson, QA Data Scientist, Revolution Analytics

Introduction

As most readers are well aware, market return data tends to have heavier tails than that which can be captured by a normal distribution; furthermore, skewness will not be captured either. For this reason, a four parameter distribution such as the Generalized Lambda Distribution (GLD) can give us a more realistic representation of the behavior of market returns, and a source from which to draw random samples to simulate returns.

The R package GLDEX provides a fairly straightforward and well-documented solution for fitting a GLD to market return data.  Documentation in pdf form may be found here.  An accompanying paper written by the author of the GLDEX package, Steven Su, on is also available for download; it is a very well presented overview of the GLD, along with details and examples on using the GLDEX package.

Brief Background

The four parameters of the GLD are, not surprisingly, λ1, λ2, λ3, and λ4.  Without going into theoretical details, suffice it to say that λ1 and λ2 are measures of location and scale respectively, and the skewness and kurtosis of the distribution are determined by λ3 and λ4.

Furthermore, there are two forms of the GLD that are implemented in GLDEX, namely those of Ramberg and Schmeiser (1974), and Freimer, Mudholkar, Kollia, and Lin (1988).  These are commonly abbreviated as RS and FMKL.

A more detailed theoretical discussion may be found in the paper by Su noted above.

Example

To demonstrate fitting a GLD to financial returns, let’s fetch 20 years of daily closing prices for the SPY ETF which tracks the S&P 500, and then calculate the corresponding daily log returns.  Before starting, be sure that you have installed both the GLDEX and quantmod packages; quantmod is used for obtaining the market data.

require(GLDEX)
require(quantmod)

getSymbols("SPY", from = "1994-02-01")  
SPY.Close <- SPY[,4] # Closing prices

SPY.vector <- as.vector(SPY.Close)

# Calculate log returns
sp500 <- diff(log(SPY.vector), lag = 1)
sp500 <- sp500[-1] # Remove the NA in the first position

Next, let’s use the function in GLDEX to compute the first four moments of the data:

# Set normalise="Y" so that kurtosis is calculated with
# reference to kurtosis = 0 under Normal distribution
fun.moments.r(sp500, normalise = "Y")

which gives us the following:

        mean       variance      skewness      kurtosis
0.0002659639  0.0001539469 -0.0954589371  9.4837879957

Now, let’s fit a GLD to the return data by using the fun.data.fit.mm(.) function:

spLambdaDist = fun.data.fit.mm(sp500)

Remark:  running the above command will result in the following message:

"There were 50 or more warnings (use warnings() to see the first 50)"

where the individual warning messages look like this:

Warning messages:
1: In beta(a, b) : NaNs produced
2: In beta(a, b) : NaNs produced
3: In beta(a, b) : NaNs produced

These warnings may be safely ignored. Now, let’s look at the contents of the spLambdaDist object:

> spLambdaDist

             RPRS        RMFMKL
[1,]  3.753968e-04  3.234195e-04
[2,] -4.660455e+01  2.031910e+02
[3,] -1.673535e-01 -1.694597e-01
[4,] -1.638032e-01 -1.613267e-01

What this gives is the set of estimated lambda parameters λ1 through λ4 for both the RS version (1st column) and the FMKL version (2nd column) of the GLD.

There is also a convenient plotting function in the package that will display the histogram of the data along with the density curves for the RS and FMKL fits:

fun.plot.fit(fit.obj = spLambdaDist, data = sp500, nclass = 100,param = c("rs", "fmkl"), xlab = "Returns")

where fit.obj is our fitted GLD object (containing the lambda parameters), data represents the returns data sp500, nclass is the number of partitions to use for the histogram, param tells the function which models to use (we have chosen both RS and FMKL here), and xlab is the label to use for the horizontal axis.

The resulting plot is as follows here:


RPRS

Note that, as in the case of the lambda parameters, RPRS refers to the RS representation, and RMFMKL to that of the FMKL.

Now that we have fitted the model, we can generate simulated returns using the rgl(.) function, which will select a random sample for a given parametrization.

In order to use this function, we need to separate out the individual lambda parameters for the RS and FMKL versions of our fitted distributions; the rgl(.) function requires individual input for each lambda parameter, as we will soon see.

lambda_params_rs <- spLambdaDist[, 1]
lambda1_rs <- lambda_params_rs[1]
lambda2_rs <- lambda_params_rs[2]
lambda3_rs <- lambda_params_rs[3]
lambda4_rs <- lambda_params_rs[4]

lambda_params_fmkl <- spLambdaDist[, 2]
lambda1_fmkl <- lambda_params_fmkl[1]
lambda2_fmkl <- lambda_params_fmkl[2]
lambda3_fmkl <- lambda_params_fmkl[3]
lambda4_fmkl <- lambda_params_fmkl[4]

Now, let’s generate a set of simulated returns with approximately the same moments as what we found with our market data.  To do this, we need a large number of draws using the rgl(.) function; through some trial and error, n = 10,000,000 gets us about as close as we can with each version (RS and FKML):

# RS version:
set.seed(100)    # Set seed to obtain a reproducible set
rs_sample <- rgl(n = 10000000, lambda1=lambda1_rs, lambda2 = lambda2_rs,
                  lambda3 = lambda3_rs,
                  lambda4 = lambda4_rs,param = "rs")

# Moments of simulated returns using RS method:
fun.moments.r(rs_sample, normalise="Y")

# Moments calculated from market data:
fun.moments.r(sp500, normalise="Y")

# FKML version:
set.seed(100)    # Set seed to obtain a reproducible set
fmkl_sample <- rgl(n = 10000000, lambda1=lambda1_fmkl, lambda2 =                                lambda2_fmkl,lambda3 = lambda3_fmkl,
                   lambda4 = lambda4_fmkl,param = "fmkl")

# Moments of simulated returns using FMKL method:
fun.moments.r(fmkl_sample, normalise="Y")

# Moments calculated from market data:
fun.moments.r(sp500, normalise="Y")       

Comparing results for the RS version vs S&P 500 market data, we get:

> fun.moments.r(rs_sample, normalise="Y")

      mean         variance     skewness      kurtosis
2.660228e-04  8.021569e-05 -1.035707e-01  9.922937e+00

> fun.moments.r(sp500, normalise="Y")

        mean      variance      skewness      kurtosis
0.0002659639  0.0001539469 -0.0954589371  9.4837879957

And for FKML vs S&P 500 market data, we get:

> fun.moments.r(fmkl_sample, normalise="Y")

      mean      variance      skewness      kurtosis
0.0002660137  0.0001537927 -0.1042857096  9.9498480532

> fun.moments.r(sp500, normalise="Y")

    mean      variance      skewness      kurtosis
0.0002659639  0.0001539469 -0.0954589371  9.4837879957

So, while we are reasonably close for the mean, skewness, and kurtosis in each case, we get better results for variance with the FKML version.

Summary

By fitting a four-parameter Generalized Lambda Distribution to market data, we are able to preserve skewness and kurtosis of the observed data; this would not be possible using a normal distribution with only the first two moments available as parameters.  Kurtosis, in particular, is critical, as this captures the fat-tailed characteristics present in market data, allowing risk managers to better assess the risk of market downturns and “black swan” events.

We were able to use the GLDEX package to construct a large set of simulated returns having approximately the same four moments as that of the observed market data, from which return scenarios may be drawn for risk and pricing models, for example.

The example shown above only scratches the surface of how the GLD can be utilized in computational finance.  For a more in-depth discussion, this paper by Chalabi, Scott, and Wurtz is one good place to start.


To leave a comment for the author, please follow the link and comment on his blog: Revolutions.

R-bloggers.com offers daily e-mail updates about R news and tutorials on topics such as: visualization (ggplot2, Boxplots, maps, animation), programming (RStudio, Sweave, LaTeX, SQL, Eclipse, git, hadoop, Web Scraping) statistics (regression, PCA, time series, trading) and more...

Intraday data

$
0
0

(This article was first published on Systematic Investor » R, and kindly contributed to R-bloggers)

In the Intraday Backtest post I showed an example of loading and working with Forex Intraday data from the FXHISTORICALDATA.COM. Recently, I came across another interesting source of Intraday data at the Bonnot Gang site. Please note that you will have to register to get access to the Intraday data; the registration is free.

Today, I want examine quality of the Intraday data from the Bonnot Gang and show how it can be integrated into Backtest using the Systematic Investor Toolbox. For the example below, please first download and save 1 minute Intraday historical data for SPX and GLD. Next let’s load and plot time series for SPX.

###############################################################################
# Load Systematic Investor Toolbox (SIT)
# http://systematicinvestor.wordpress.com/systematic-investor-toolbox/
###############################################################################
con = gzcon(url('http://www.systematicportfolio.com/sit.gz', 'rb'))
    source(con)
close(con)

	#*****************************************************************
	# Load historical data
	#****************************************************************** 
	load.packages('quantmod')	

	# data from http://thebonnotgang.com/tbg/historical-data/
	spath = 'c:/Desktop/'
	# http://stackoverflow.com/questions/14440661/dec-argument-in-data-tablefread
		Sys.localeconv()["decimal_point"]
		Sys.setlocale("LC_NUMERIC", "French_France.1252")
	
	data <- new.env()
	data$SPY = read.xts(paste0(spath,'SPY_1m.csv'), 
		sep = ';', date.column = 3, format='%Y-%m-%d %H:%M:%S', index.class = c("POSIXlt", "POSIXt"))

	data$GLD = read.xts(paste0(spath,'GLD_1m.csv'), 
		sep = ';', date.column = 3, format='%Y-%m-%d %H:%M:%S', index.class = c("POSIXlt", "POSIXt"))

	#*****************************************************************
	# Create plot for Nov 1, 2012 and 2013
	#****************************************************************** 
	layout(c(1,1,2))		
	plota(data$SPY['2012:11:01'], type='candle', main='SPY on Nov 1st, 2012', plotX = F)
	plota(plota.scale.volume(data$SPY['2012:11:01']), type = 'volume')	

	layout(c(1,1,2))		
	plota(data$SPY['2013:11:01'], type='candle', main='SPY on Nov 1st, 2013', plotX = F)
	plota(plota.scale.volume(data$SPY['2013:11:01']), type = 'volume')	

plot1

plot2

It jumps right away that the data provider had changed the time scale, in 2012 data was recorded from 9:30 to 16:00 and in 2013 data was recorded from 13:30 to 20:00.

Next, let’s check if there are any big gaps in the series Intraday.

	#*****************************************************************
	# Data check for Gaps in the series Intraday
	#****************************************************************** 
	i = 'GLD'
	dates = index(data[[i]])
	factor = format(dates, '%Y%m%d')
	gap = tapply(dates, factor, function(x) max(diff(x)))
	
	gap[names(gap[gap > 4*60])]
	data[[i]]['2013:02:19']

	i = 'SPY'
	dates = index(data[[i]])
	factor = format(dates, '%Y%m%d')
	gap = tapply(dates, factor, function(x) max(diff(x)))
	
	gap[names(gap[gap > 4*60])]
	data[[i]]['2013:02:19']	

Please see below the dates for GLD with gaps over 4 minutes

20120801   12
20121226   22
20130219   48
20130417    6
20130531    6
20130705    8
20131105    4
20131112    4
20140124   14
20140210   22
20140303    6

A detailed look at the Feb 19th, 2013 shows a 48 minute gap between 14:54 and 15:42

> data[[i]]['2013:02:19 14:50::2013:02:19 15:45']
                        open    high      low   close volume
2013-02-19 14:50:54 155.3110 155.315 155.3001 155.315   8900
2013-02-19 14:51:56 155.3100 155.310 155.3100 155.310 119900
2013-02-19 14:52:52 155.3100 155.330 155.3000 155.305 354600
2013-02-19 14:53:55 155.2990 155.300 155.2800 155.280      0
2013-02-19 14:54:54 155.2900 155.290 155.2659 155.279  10500
2013-02-19 15:42:57 155.3400 155.360 155.3400 155.350 587900
2013-02-19 15:43:57 155.3501 155.355 155.3300 155.332   8300
2013-02-19 15:44:59 155.3395 155.340 155.3200 155.340  10700
2013-02-19 15:45:55 155.3300 155.340 155.3300 155.340   5100

So there is definitely something going on with data acquisition at that time.

Next, let’s compare Intrada data with daily data:

	#*****************************************************************
	# Data check : compare with daily
	#****************************************************************** 
	data.daily <- new.env()
		quantmod::getSymbols(spl('SPY,GLD'), src = 'yahoo', from = '1970-01-01', env = data.daily, auto.assign = T)   
     
	layout(1)		
	plota(data$GLD, type='l', col='blue', main='GLD')
		plota.lines(data.daily$GLD, type='l', col='red')
	plota.legend('Intraday,Daily', 'blue,red')	
	

	plota(data$SPY, type='l', col='blue', main='SPY')
		plota.lines(data.daily$SPY, type='l', col='red')
	plota.legend('Intraday,Daily', 'blue,red')		

plot3

plot4

The Intraday data matches Daily data very well.

Please note that the raw Intraday data comes with seconds time stamp, for back-testing purposes we will also want to round date time to the nearest minute, so that we can merge the Intraday data series without introducing multiple entries for the same minute. For example:

	#*****************************************************************
	# Round to the next minute
	#****************************************************************** 
	GLD.sample = data$GLD['2012:07:10::2012:07:10 09:35']
	SPY.sample= data$SPY['2012:07:10::2012:07:10 09:35']
	
	merge( Cl(GLD.sample), Cl(SPY.sample) )
	
	# round to the next minute
	index(GLD.sample) = as.POSIXct(format(index(GLD.sample) + 60, '%Y-%m-%d %H:%M'), format = '%Y-%m-%d %H:%M')
	index(SPY.sample) = as.POSIXct(format(index(SPY.sample) + 60, '%Y-%m-%d %H:%M'), format = '%Y-%m-%d %H:%M')
	
	merge( Cl(GLD.sample), Cl(SPY.sample) )
> merge( Cl(GLD.sample), Cl(SPY.sample) )
                       close close.1
2012-07-10 09:30:59 155.0900 136.030
2012-07-10 09:31:59 155.1200 136.139
2012-07-10 09:32:58 155.1100      NA
2012-07-10 09:32:59       NA 136.180
2012-07-10 09:33:56 155.1400      NA
2012-07-10 09:33:59       NA 136.100
2012-07-10 09:34:59 155.0999 136.110
2012-07-10 09:35:59 155.0200 136.180

> merge( Cl(GLD.sample), Cl(SPY.sample) )
                       close close.1
2012-07-10 09:31:00 155.0900 136.030
2012-07-10 09:32:00 155.1200 136.139
2012-07-10 09:33:00 155.1100 136.180
2012-07-10 09:34:00 155.1400 136.100
2012-07-10 09:35:00 155.0999 136.110
2012-07-10 09:36:00 155.0200 136.180

I got an impression that these Intraday data is not really authentic, but was collected by running Intraday snap shoots of the quotes and later on processed to create one minute bars. But I might be wrong.

Next, let’s clean the Intraday data, by removing any day with time gaps over 4 minutes and let’s round all times to the nearest minute:

	#*****************************************************************
	# Clean data
	#****************************************************************** 
	# remove dates with gaps over 4 min
	for(i in ls(data)) {
		dates = index(data[[i]])
		factor = format(dates, '%Y%m%d')
		gap = tapply(dates, factor, function(x) max(diff(x)))
		data[[i]] = data[[i]][ is.na(match(factor, names(gap[gap > 4*60]))) ]
	}		
	
	common = unique(format(index(data[[ls(data)[1]]]), '%Y%m%d'))
	for(i in ls(data)) {
		dates = index(data[[i]])
		factor = format(dates, '%Y%m%d')	
		common = intersect(common, unique(factor))
	}
	
	# remove days that are not present in both time series
	for(i in ls(data)) {
		dates = index(data[[i]])
		factor = format(dates, '%Y%m%d')
		data[[i]] = data[[i]][!is.na(match(factor, common)),]
	}
		
	#*****************************************************************
	# Round to the next minute
	#****************************************************************** 
	for(i in ls(data))
		index(data[[i]]) = as.POSIXct(format(index(data[[i]]) + 60, '%Y-%m-%d %H:%M'), tz = Sys.getenv('TZ'), format = '%Y-%m-%d %H:%M')

Once Intraday data is ready, we can test a simple equal weight strategy:

	#*****************************************************************
	# Load historical data
	#****************************************************************** 
	bt.prep(data, align='keep.all', fill.gaps = T)

	prices = data$prices   
	dates = data$dates
		nperiods = nrow(prices)
	
	models = list()

	#*****************************************************************
	# Benchmarks
	#****************************************************************** 							
	data$weight[] = NA
		data$weight$SPY = 1
	models$SPY = bt.run.share(data, clean.signal=F)

	data$weight[] = NA
		data$weight$GLD = 1
	models$GLD = bt.run.share(data, clean.signal=F)
	
	data$weight[] = NA
		data$weight$SPY = 0.5
		data$weight$GLD = 0.5
	models$EW = bt.run.share(data, clean.signal=F)

	
    #*****************************************************************
    # Create Report
    #******************************************************************    
    strategy.performance.snapshoot(models, T)	

plot5

In this post, I tried to outline the basic steps you need to take if you are planning to work with a new data source. Next, I plan to follow with more examples of testing Intraday strategies.

To view the complete source code for this example, please have a look at the bt.intraday.thebonnotgang.test() function in bt.test.r at github.


To leave a comment for the author, please follow the link and comment on his blog: Systematic Investor » R.

R-bloggers.com offers daily e-mail updates about R news and tutorials on topics such as: visualization (ggplot2, Boxplots, maps, animation), programming (RStudio, Sweave, LaTeX, SQL, Eclipse, git, hadoop, Web Scraping) statistics (regression, PCA, time series, trading) and more...

Capturing Intraday data

$
0
0

(This article was first published on Systematic Investor » R, and kindly contributed to R-bloggers)

I want to follow up the Intraday data post with an example of how you can capture Intraday data without too much effort by recording 1 minute snapshots of the market.

I will take market snapshots from Yahoo Finance using following function that downloads delayed market quotes with date and time stamps:

###############################################################################
# getSymbols interface to Yahoo today's delayed qoutes
# based on getQuote.yahoo from quantmod package
###############################################################################            
getQuote.yahoo.today <- function(Symbols) {
    require('data.table')
    what = yahooQF(names = spl('Symbol,Last Trade Time,Last Trade Date,Open,Days High,Days Low,Last Trade (Price Only),Volume'))
    names = spl('Symbol,Time,Date,Open,High,Low,Close,Volume')
    
    all.symbols = lapply(seq(1, len(Symbols), 100), function(x) na.omit(Symbols[x:(x + 99)]))
    out = c()
    
    for(i in 1:len(all.symbols)) {
        # download
        url = paste('http://download.finance.yahoo.com/d/quotes.csv?s=',
            join( trim(all.symbols[[i]]), ','),
            '&f=', what[[1]], sep = '')
        
        txt = join(readLines(url),'\n') 
        data = fread(paste0(txt,'\n'), stringsAsFactors=F, sep=',')
            setnames(data,names)
            setkey(data,'Symbol')      	
      	out = rbind(out, data)
    }
    out
} 

Next we can run the getQuote.yahoo.today function from 9:30 to 16:00 every minute and record market snap shoots. Please note that you will have to make some judgement calls in terms of how you want to deal with highs and lows.

Symbols = spl('IBM,AAPL')

prev = c()
while(T) {
    out = getQuote.yahoo.today(Symbols)
	
    if (is.null(prev)) 
        for(i in 1:nrow(out)) {
	    cat(names(out), '\n', sep=',', file=paste0(out$Symbol[i],'.csv'), append=F)
	    cat(unlist(out[i]), '\n', sep=',', file=paste0(out$Symbol[i],'.csv'), append=T)					
	}
    else
        for(i in 1:nrow(out)) {
	    s0 = prev[Symbol==out$Symbol[i]]
	    s1 = out[i]
	    s1$Volume = s1$Volume - s0$Volume
	    s1$Open = s0$Close
	    s1$High = iif(s1$High > s0$High, s1$High, max(s1$Close, s1$Open))
	    s1$Low  = iif(s1$Low  < s0$Low , s1$Low , min(s1$Close, s1$Open))
	    cat(unlist(s1), '\n', sep=',', file=paste0(out$Symbol[i],'.csv'), append=T)					
        }

    # copy
    prev = out
		
    # sleep 1 minute   
    Sys.sleep(60)	
} 

For example I was able to saved following quotes for AAPL:

Symbol   Time      Date    Open    High      Low   Close  Volume
  AAPL 2:57pm 3/10/2014 528.360 533.330 528.3391 531.340 5048146
  AAPL 2:58pm 3/10/2014 531.340 531.570 531.3400 531.570    7650
  AAPL 2:59pm 3/10/2014 531.570 531.570 531.5170 531.517    2223
  AAPL 3:00pm 3/10/2014 531.517 531.517 531.4500 531.450    5283
  AAPL 3:01pm 3/10/2014 531.450 531.450 531.2900 531.290    4413
  AAPL 3:02pm 3/10/2014 531.290 531.490 531.2900 531.490    2440

Unfortunately, there is no way to go back in history, unless you buy historical intraday data. But if you want to start recording market moves yourself, following code should get you started.


To leave a comment for the author, please follow the link and comment on his blog: Systematic Investor » R.

R-bloggers.com offers daily e-mail updates about R news and tutorials on topics such as: visualization (ggplot2, Boxplots, maps, animation), programming (RStudio, Sweave, LaTeX, SQL, Eclipse, git, hadoop, Web Scraping) statistics (regression, PCA, time series, trading) and more...

Probabilistic Momentum with Intraday data

$
0
0

(This article was first published on Systematic Investor » R, and kindly contributed to R-bloggers)

I want to follow up the Intraday data post with testing the Probabilistic Momentum strategy on Intraday data. I will use Intraday data for SPY and GLD from the Bonnot Gang to test the strategy.

##############################################################################
# Load Systematic Investor Toolbox (SIT)
# http://systematicinvestor.wordpress.com/systematic-investor-toolbox/
###############################################################################
setInternet2(TRUE)
con = gzcon(url('http://www.systematicportfolio.com/sit.gz', 'rb'))
    source(con)
close(con)

	#*****************************************************************
	# Load historical data
	#****************************************************************** 
	load.packages('quantmod')	

	# data from http://thebonnotgang.com/tbg/historical-data/
	# please save SPY and GLD 1 min data at the given path
	spath = 'c:/Desktop/'
	data = bt.load.thebonnotgang.data('SPY,GLD', spath)
	
	data1 <- new.env()		
		data1$FI = data$GLD
		data1$EQ = data$SPY
	data = data1
	bt.prep(data, align='keep.all', fill.gaps = T)

	lookback.len = 120
	confidence.level = 60/100
	
	prices = data$prices
		ret = prices / mlag(prices) - 1 
		
	models = list()
	
	#*****************************************************************
	# Simple Momentum
	#****************************************************************** 
	momentum = prices / mlag(prices, lookback.len)
	data$weight[] = NA
		data$weight$EQ[] = momentum$EQ > momentum$FI
		data$weight$FI[] = momentum$EQ <= momentum$FI
	models$Simple  = bt.run.share(data, clean.signal=T) 	

	#*****************************************************************
	# Probabilistic Momentum + Confidence Level
	# http://cssanalytics.wordpress.com/2014/01/28/are-simple-momentum-strategies-too-dumb-introducing-probabilistic-momentum/
	# http://cssanalytics.wordpress.com/2014/02/12/probabilistic-momentum-spreadsheet/
	#****************************************************************** 
	ir = sqrt(lookback.len) * runMean(ret$EQ - ret$FI, lookback.len) / runSD(ret$EQ - ret$FI, lookback.len)
	momentum.p = pt(ir, lookback.len - 1)
		
	data$weight[] = NA
		data$weight$EQ[] = iif(cross.up(momentum.p, confidence.level), 1, iif(cross.dn(momentum.p, (1 - confidence.level)), 0,NA))
		data$weight$FI[] = iif(cross.dn(momentum.p, (1 - confidence.level)), 1, iif(cross.up(momentum.p, confidence.level), 0,NA))
	models$Probabilistic  = bt.run.share(data, clean.signal=T) 	

	data$weight[] = NA
		data$weight$EQ[] = iif(cross.up(momentum.p, confidence.level), 1, iif(cross.up(momentum.p, (1 - confidence.level)), 0,NA))
		data$weight$FI[] = iif(cross.dn(momentum.p, (1 - confidence.level)), 1, iif(cross.up(momentum.p, confidence.level), 0,NA))
	models$Probabilistic.Leverage = bt.run.share(data, clean.signal=T) 	
	
	#*****************************************************************
	# Create Report
	#******************************************************************        
	strategy.performance.snapshoot(models, T)    

plot1

Next, let’s examine the hourly perfromance of the strategy.

	#*****************************************************************
	# Hourly Performance
	#******************************************************************    
	strategy.name = 'Probabilistic.Leverage'
	ret = models[[strategy.name]]$ret	
		ret.number = 100*as.double(ret)
		
	dates = index(ret)
	factor = format(dates, '%H')
    
	layout(1:2)
	par(mar=c(4,4,1,1))
	boxplot(tapply(ret.number, factor, function(x) x),outline=T, main=paste(strategy.name, 'Distribution of Returns'), las=1)
	barplot(tapply(ret.number, factor, function(x) sum(x)), main=paste(strategy.name, 'P&L by Hour'), las=1)

plot2

There are lots of abnormal returns in the 9:30-10:00am box due to big overnight returns. I.e. a return from today’s open to prior’s day close. If we exclude this observation every day, the distribution each hour is more consistent.

   	#*****************************************************************
   	# Hourly Performance: Remove first return of the day (i.e. overnight)
   	#******************************************************************    
   	day.stat = bt.intraday.day(dates)
	ret.number[day.stat$day.start] = 0

   	layout(1:2)
   	par(mar=c(4,4,1,1))
	boxplot(tapply(ret.number, factor, function(x) x),outline=T, main=paste(strategy.name, 'Distribution of Returns'), las=1)
	barplot(tapply(ret.number, factor, function(x) sum(x)), main=paste(strategy.name, 'P&L by Hour'), las=1)

plot3

The strategy performs best in the morning and dwindles down in the afternoon and overnight.

These hourly seasonality plots are just a different way to analyze performance of the strategy based on Intraday data.

To view the complete source code for this example, please have a look at the bt.strategy.intraday.thebonnotgang.test() function in bt.test.r at github.


To leave a comment for the author, please follow the link and comment on his blog: Systematic Investor » R.

R-bloggers.com offers daily e-mail updates about R news and tutorials on topics such as: visualization (ggplot2, Boxplots, maps, animation), programming (RStudio, Sweave, LaTeX, SQL, Eclipse, git, hadoop, Web Scraping) statistics (regression, PCA, time series, trading) and more...

Solving Quadratic Progams with R’s quadprog package

$
0
0

(This article was first published on quantitate, and kindly contributed to R-bloggers)
In this post, we'll explore a special type of nonlinear constrained optimization problems called quadratic programs. Quadratic programs appear in many practical applications, including portfolio optimization and in solving support vector machine (SVM) classification problems. There are several packages available to solve quadratic programs in R. Here, we'll work with the quadprog package. Before we dive into some examples with quadprog, we'll give a brief overview of the terminology and mechanics of quadratic programs.

Quick Overview of Quadratic Programming

In a quadratic programming problem, we consider a quadratic objective function: $$ Q(x) = \frac{1}{2} x^T D x - d^T x + c.$$ Here, $x$ is a vector in $\mathbb{R}^n$, $D$ is an $n \times n$ symmetric positive definite matrix, $d$ is a constant vector in $\mathbb{R}^n$ and $c$ is a scalar constant. The function $Q(x)$ is sometimes referred to as a quadratic form and it generalizes the quadratic function $q(x) = ax^2 +bx + c$ to higher dimensions. The key feature to note about $Q(x)$ is that it is a convex function.

We also impose a system of linear constraints on the vector $x \in \mathbb{R}^n$. We write these constraints in the form $$ Ax = f \qquad Bx \geq g.$$  Here $A$ is an $m_1 \times n$ matrix with $m_1 \leq n$ and $B$ is a $m_2 \times n$ matrix.  The vectors $f$ and $g$ have lengths $m_1$ and $m_2$ respectively.  This specification is general enough to allow us to consider a variety of practical conditions on the components of $x$, e.g. we can force $x$ to satisfy the sum condition $$ \sum_{i=1}^n x_i = 1 $$ or the box constraints $a_i \leq x_i \leq b_i$. We'll describe how to encode practical constraint conditions into matrix systems below.

With this notation out of the way, we can write the quadratic program (QP) compactly as: $$ \left\{ \begin{array}{l} \mathrm{minimize}_{x \in \mathbb{R}^n}: \qquad Q(x) = \frac{1}{2} x^T D x - d^T x + c \\ \mathrm{subject\; to:} \qquad Ax = f \qquad Bx \geq g \end{array} \right.$$

Example #1:

Consider the objective function: $$ \begin{eqnarray*} Q(x,y) &=& \frac{1}{2} \left[ \begin{matrix} x & y \end{matrix} \right] \left[ \begin{matrix} 2 & -1 \\ -1 & 2 \end{matrix} \right]\left[ \begin{matrix} x \\ y \end{matrix} \right] - \left[ \begin{matrix} -3 & 2 \end{matrix} \right] \left[ \begin{matrix} x \\ y \end{matrix} \right] + 4 \\ &=& x^2 + y^2 -xy +3x -2y + 4 . \end{eqnarray*}$$ We seek to minimize this function over the triangular region $$\begin{eqnarray*} y &\geq& 2 - x \\ y &\geq& -2 + x \\ y &\leq& 3. \end{eqnarray*}$$
We can find the vertices of this triangle and plot the region in R:
plot(0, 0, xlim = c(-2,5.5), ylim = c(-1,3.5), type = "n", 
xlab = "x", ylab = "y", main="Feasible Region")
polygon(c(2,5,-1), c(0,3,3), border=TRUE, lwd=4, col="blue")

To solve this QP with the quadprog library, we'll need to translate both our objective function and the constraint system into the matrix formulation required by quadprog. From the quadprog documentation
This routine implements the dual method of Goldfarb and Idnani (1982, 1983) for solving quadratic programming problems of the form min(-d^T b + 1/2 b^T D b) with the constraints A^T b >= b_0.
It's not hard to see how to put the quadratic form $Q(x,y)$ into the correct matrix form for the objective function of quadprog (but be sure to note the sign pattern and factors of two).  First we observe that, for any constant $c$, the minimizer of $Q(x,y)+c$ is the same as the minimizer of $Q(x,y)$. We can therefore ignore all constant terms in the quadratic form $Q(x,y)$. We set:
$$D =  \left[ \begin{matrix} 2 & -1 \\ -1 & 2 \end{matrix} \right] \qquad  d = \left[ \begin{matrix} -3 \\ 2 \end{matrix} \right]. $$
We can write the constraint equations in the form:
$$\left[ \begin{matrix} 1 & 1 \\ -1 & 1 \\ 0 & -1 \end{matrix} \right] \left[ \begin{matrix} x \\ y \end{matrix} \right] \geq \left[ \begin{matrix} 2 \\ -2 \\ -3 \end{matrix} \right]$$ so that $$A = \left[ \begin{matrix} 1 & 1 \\ -1 & 1 \\ 0 & -1 \end{matrix} \right]^T \qquad b_0 = \left[ \begin{matrix} 2 \\ -2 \\ -3 \end{matrix} \right].$$ Here is the complete implementation in R:

require(quadprog)
Dmat <- 2*matrix(c(1,-1/2,-1/2,1), nrow = 2, byrow=TRUE)
dvec <- c(-3,2)
A <- matrix(c(1,1,-1,1,0,-1), ncol = 2 , byrow=TRUE)
bvec <- c(2,-2,-3)
Amat <- t(A)
sol <- solve.QP(Dmat, dvec, Amat, bvec, meq=0)

Note the parameter meq is used to tell quadprog that first meq constraint conditions should be treated as equalities. Let's inspect the output of the quadprog solver:
> sol
$solution
[1] 0.1666667 1.8333333
$value
[1] -0.08333333
$unconstrained.solution
[1] -1.3333333 0.3333333
$iterations
[1] 2 0
$Lagrangian
[1] 1.5 0.0 0.0
$iact
[1] 1
The point $(1/6,11/6)$ is the unique minimizer of $Q(x,y)$ subject to the constraint conditions. The point $(-4/3,1/3)$ is the unique minimum of $Q(x,y)$. The slots iterations, Lagrangian, and iact are diagnostics describing the performance of the quadprog algorithm. We'll provide a discussion of these values in a future post. Now, let's visualize the QP solution. For this, we superimpose the boundary of the feasible region on the contour plot of the surface $Q(x,y)$.
In this plot, dark green shading indicates lower altitude regions of the surface $Q(x,y)$, while lighter regions indicate higher altitudes. The red point is the global minimum of $Q(x,y)$ and the yellow point is the solution to the QP.

# Contour Plot with Feasible region overlay
require(lattice)
qp_sol <- sol$solution
uc_sol <- sol$unconstrained.solution
x <- seq(-2, 5.5, length.out = 500)
y <- seq(-1, 3.5, length.out = 500)
grid <- expand.grid(x=x, y=y)
grid$z <- with(grid, x^2 + y^2 -x*y +3*x -2*y + 4)
levelplot(z~x*y, grid, cuts=30,
panel = function(...){
panel.levelplot(...)
panel.polygon(c(2,5,-1),c(0,3,3), border=TRUE, lwd=4, col="transparent")
panel.points(c(uc_sol[1],qp_sol[1]),
c(uc_sol[2],qp_sol[2]),
lwd=5, col=c("red","yellow"), pch=19)},
colorkey=FALSE,
col.regions = terrain.colors(30))

Example #2:

Suppose we have selected 10 stocks from which to build a portfolio $\Pi$. We want to determine how much of each stock to include in our portfolio.

The expected monthly return rate of our portfolio is $$ \overline{r_\Pi} = \sum_{i=1}^{10} w_i \overline{r_i} $$ where $\overline{r_i}$ is the mean monthly return rate on asset $i$ and $w_i$ is the fraction of the portfolio value due to asset $i$. Note that the portfolio weights $w_i$ satisfy the constraints $$ 0 \leq w_i \leq 1 \qquad \qquad \sum_{i=1}^{10} w_i = 1. $$ In practice, we can only estimate the average returns $\overline{r_i}$ using past price data. This is a snap using R's quantmod package:

# Get monthly return data from 2012 through 2013
require(quantmod)
myStocks <- c("AAPL","XOM","GOOG","MSFT","GE","JNJ","WMT","CVX","PG","WF")
getSymbols(myStocks ,src='yahoo')
returnsList <- lapply(myStocks,
function(s) periodReturn(eval(parse(text=s)),
period='monthly', subset='2012::2013'))
The data frame returns.df contains a time series of monthly returns for each of the 10 specified ticker symbols. Let's plot the monthly returns:

# Plot monthly return data
require(ggplot2)
require(reshape2)
returns2 <- as.data.frame(returns.df)
returns2$date <- row.names(returns2)
returns2 <- melt(returns2, id="date")
ggplot(returns2, aes(x=date,y=value, group=variable)) +
geom_line(aes(color=variable), lwd=1.5) +
ylab("Monthly Return")+ xlab("Date") +
theme(axis.text.x = element_text(angle = 90, hjust = 1))

From this plot, we can see that there is significant fluctuation in return rates. This suggests that the variance of $r_i$ and covariances of $r_i$ and $r_j$ should play a role in our analysis. In effect, these variances and covariances indicate how likely we are to actually observe a portfolio return close to our expected return $\overline{r_\Pi}$.

To take into account the risk of deviations in our portfolio return, define the quadratic form $$Q(\vec{w}) = \vec{w}^T C \vec{w}, $$ where $C$ is the covariance matrix of the returns $r_i$. To solve the portfolio allocation problem, we'll try to determine the weights $\vec{w} = (w_1,...,w_{10})$ so that the risk function $Q(\vec{w})$ is minimized. But there are some restrictions to consider. In addition to requiring that $\sum_{i=1}^{10} w_i =1$ and $0 \leq w_i \leq 1$, we may also require a minimum return from the portfolio. For example, we might demand a minimum expected monthly return of 1%: $$ \sum_{i=1}^{10} w_i E(r_i) \geq .01.$$ We can prove that the covariance matrix $C$ is always symmetric positive definite (except in the case of perfect multicollinearity), so this constrained minimization problem is a quadratic programming problem of the type that can be handled by quadprog.

Let's now describe how to implement the quadprog solver for this problem. First, compute the average returns and covariance matrix in R:

# Compute the average returns and covariance matrix of the return series
r <- matrix(colMeans(returns.df), nrow=1)
C <- cov(returns.df)
The constraints in this case are a little bit more tricky than in Example #1. For quadprog, all of our constraints must be expressed in a linear system of the form $A^T \vec{w} \geq f$. The system should be arranged so that any equality constraints appear in the first $m$ rows of the system. We build up the matrix $A^T$ step by step using rbind and applying a transpose at the very end.

To enforce the sum to one condition we need: $$ \left[ \begin{matrix} 1 & 1 & \cdots 1 \end{matrix} \right] \vec{w} = 1. $$ This equality condition should appear first in the system. To enforce the minimum expected return, we require $r \cdot \vec{w} \geq .01$ where $r$ is the row of average return rates obtained from the dataset. To force $0 \leq w_i \leq 1$, we require $$ I_{10} \vec{w} \geq 0 \qquad \qquad -I_{10} \vec{w} \geq - 1$$ where $I_{10}$ is the $10 \times 10$ identity matrix. Putting these steps together:

# Stage and solve the QP
require(quadprog)
A <- matrix(1,1,10)
A <- rbind(A, r, diag(10),-diag(10))
f <- c(1, 0.01, rep(0,10),rep(-1,10))
sol <- solve.QP(Dmat=C, dvec = rep(0,10), Amat=t(A), bvec=f, meq=1)
Let's inspect the optimal allocation:

require(ggplot2)
portfolio <- data.frame(name = myStocks, w = round(sol$solution,3))
ggplot(portfolio, aes(x=name, y=w)) + geom_bar(stat="identity", fill="blue")

The expected return from this allocation is about 1.2%. It is instructive to solve the quadratic program with different minimum return requirements. For example, there is a solution to this problem with minimum required expected return greater than or equal to 2% but no solution with minimum required expected return greater than or equal to 3%. What is key to note is that the solution with the 2% restriction has a higher value of $Q(\vec{w})$ (more risk) compared to the lower risk solution to the problem with the 1% restriction. As we'd expect, quadratic programming doesn't allow us to escape the risk-return trade-off; it only provides the lowest risk allocation for a given minimum expected return requirement.

To leave a comment for the author, please follow the link and comment on his blog: quantitate.

R-bloggers.com offers daily e-mail updates about R news and tutorials on topics such as: visualization (ggplot2, Boxplots, maps, animation), programming (RStudio, Sweave, LaTeX, SQL, Eclipse, git, hadoop, Web Scraping) statistics (regression, PCA, time series, trading) and more...

Quality of Historical Stock Prices from Yahoo Finance

$
0
0

(This article was first published on Systematic Investor » R, and kindly contributed to R-bloggers)

I recently looked at the strategy that invests in the components of S&P/TSX 60 index, and discovered that there are some abnormal jumps/drops in historical data that I could not explain. To help me spot these points and remove them, I created a helper function data.clean() function in data.r at github. Following is an example of how you can use data.clean() function:

##############################################################################
# Load Systematic Investor Toolbox (SIT)
# http://systematicinvestor.wordpress.com/systematic-investor-toolbox/
###############################################################################
setInternet2(TRUE)
con = gzcon(url('http://www.systematicportfolio.com/sit.gz', 'rb'))
    source(con)
close(con)

	###############################################################################
	# S&P/TSX 60 Index as of Mar 31 2014
	# http://ca.spindices.com/indices/equity/sp-tsx-60-index
	###############################################################################	
	load.packages('quantmod')

	tickers = spl('AEM,AGU,ARX,BMO,BNS,ABX,BCE,BB,BBD.B,BAM.A,CCO,CM,CNR,CNQ,COS,CP,CTC.A,CCT,CVE,GIB.A,CPG,ELD,ENB,ECA,ERF,FM,FTS,WN,GIL,G,HSE,IMO,K,L,MG,MFC,MRU,NA,PWT,POT,POW,RCI.B,RY,SAP,SJR.B,SC,SLW,SNC,SLF,SU,TLM,TCK.B,T,TRI,THI,TD,TA,TRP,VRX,YRI')
		tickers = gsub('\\.', '-', tickers)
	tickers.suffix = '.TO'

	data <- new.env()
	for(ticker in tickers)
		data[[ticker]] = getSymbols(paste0(ticker, tickers.suffix), src = 'yahoo', from = '1980-01-01', auto.assign = F)

	###############################################################################
	# Plot Abnormal Series
	###############################################################################
	layout(matrix(1:4,2))	
	plota(data$ARX$Adjusted['2000'], type='p', pch='|', main='ARX Adjusted Price in 2000')	
	plota(data$COS$Adjusted['2000'], type='p', pch='|', main='COS Adjusted Price in 2000')	
	plota(data$ERF$Adjusted['2000'], type='p', pch='|', main='ERF Adjusted Price in 2000')	
	plota(data$YRI$Adjusted['1999'], type='p', pch='|', main='YRI Adjusted Price in 1999')	

	###############################################################################
	# Clean data
	###############################################################################
	data.clean(data, min.ratio = 2)	

plot1

> data.clean(data, min.ratio = 2)	
Removing BNS TRP have less than 756 observations
Abnormal price found for ARX 23-Jun-2000 Ratio : 124.7
Abnormal price found for ARX 26-Sep-2000 Inverse Ratio : 99.4
Abnormal price found for COS 23-Jun-2000 Ratio : 124.1
Abnormal price found for COS 26-Sep-2000 Inverse Ratio : 101.1
Abnormal price found for ERF 14-Jun-2000 Ratio : 7.9
Abnormal price found for YRI 18-Feb-1998 Ratio : 2.1
Abnormal price found for YRI 25-May-1999 Ratio : 3

It is surprising that Bank of Nova Scotia (BNS.TO) has only one year worth of historical data. I also did not find an explanations for jumps in the ARX, COS, ERF during 2000.

Next, I did same analysis for the stocks in the S&P 100 index:

	###############################################################################
	# S&P 100 as of Mar 31 2014
	# http://ca.spindices.com/indices/equity/sp-100
	###############################################################################	
	tickers = spl('MMM,ABT,ABBV,ACN,ALL,MO,AMZN,AXP,AIG,AMGN,APC,APA,AAPL,T,BAC,BAX,BRK.B,BIIB,BA,BMY,COF,CAT,CVX,CSCO,C,KO,CL,CMCSA,COP,COST,CVS,DVN,DOW,DD,EBAY,EMC,EMR,EXC,XOM,FB,FDX,F,FCX,GD,GE,GM,GILD,GS,GOOG,HAL,HPQ,HD,HON,INTC,IBM,JNJ,JPM,LLY,LMT,LOW,MA,MCD,MDT,MRK,MET,MSFT,MDLZ,MON,MS,NOV,NKE,NSC,OXY,ORCL,PEP,PFE,PM,PG,QCOM,RTN,SLB,SPG,SO,SBUX,TGT,TXN,BK,TWX,FOXA,UNP,UPS,UTX,UNH,USB,VZ,V,WMT,WAG,DIS,WFC')
	tickers.suffix = ''

	data <- new.env()
	for(ticker in tickers)
		data[[ticker]] = getSymbols(paste0(ticker, tickers.suffix), src = 'yahoo', from = '1980-01-01', auto.assign = F)

	###############################################################################
	# Plot Abnormal Series
	###############################################################################    
	layout(matrix(1:4,2))	
	plota(data$AAPL$Adjusted['2000'], type='p', pch='|', main='AAPL Adjusted Price in 2000')	
	plota(data$AIG$Adjusted['2008'], type='p', pch='|', main='AIG Adjusted Price in 2008')	
	plota(data$FDX$Adjusted['1982'], type='p', pch='|', main='1982 Adjusted Price in 1982')	

	###############################################################################
	# Clean data
	###############################################################################
	data.clean(data, min.ratio = 2)	

plot2

> data.clean(data, min.ratio = 2)	
Removing ABBV FB have less than 756 observations
Abnormal price found for AAPL 29-Sep-2000 Inverse Ratio : 2.1
Abnormal price found for AIG 15-Sep-2008 Inverse Ratio : 2.6
Abnormal price found for FDX 13-May-1982 Ratio : 8
Abnormal price found for FDX 06-Aug-1982 Ratio : 7.8
Abnormal price found for FDX 14-May-1982 Inverse Ratio : 8
Abnormal price found for FDX 09-Aug-1982 Inverse Ratio : 8

I first thought that September 29th, 2000 drop in AAPL was an data error; however, I found following news item: Apple bruises tech sector, September 29, 2000: 4:33 p.m. ET Computer maker’s warning weighs on hardware, chip stocks; Nasdaq tumbles.

So working with data requires a bit of data manipulation and a bit of detective works. Please, always have a look at the data before running any back-tests or making any conclusions.


To leave a comment for the author, please follow the link and comment on his blog: Systematic Investor » R.

R-bloggers.com offers daily e-mail updates about R news and tutorials on topics such as: visualization (ggplot2, Boxplots, maps, animation), programming (RStudio, Sweave, LaTeX, SQL, Eclipse, git, hadoop, Web Scraping) statistics (regression, PCA, time series, trading) and more...

Using R to model the classic 60/40 investing rule

$
0
0

(This article was first published on quandl blog » R quandl blog, and kindly contributed to R-bloggers)

Treelife by Timothy Poulton

Image by Timothy Poulton

 
A long-standing paradigm among savers and investors is to favor a mixture of 40% bonds and 60% equities. The simple rationale is that stocks will provide greater returns while bonds will serve as a diversifier when if equities fall. If you are saving for your pension, you probably heard this story before, but do you believe it?

At least in part, this makes sense. Stocks are more volatile and thus should yield more as compensation. Regarding diversification, we can take a stab at it and try to model the correlation between stocks and bonds, but for now let’s assume it holds that bonds will ‘defend’ us during crisis. Today we zoom in on the pain this 60/40 mixture can cause you over the years, and compare it to other alternatives. We use numbers from the last two decades to show that you may want to reconsider this common paradigm.


In general we use volatility as a measure for risk, and we use the Sharpe Ratio (mean return over standard deviation of returns) as a measure for performance of the portfolio. The Sharpe Ratio (SR) is basically how much return you get for one unit of risk you endure, the higher the SR the better. Note that you can get high SR with very low mean returns. Some savers will consciously prefer lower SR in order to get higher returns so it is also about risk preferences. Still, it is common to consider both mean (return) and standard deviation (risk) when allocating money.

For the analysis, we shall use total return indices. Just using the S&P returns does not account for dividends, and this has a real impact when we look at a long time-span. I would like to use the R-software for the analysis. Total return indices are not easily available from usual sources like the quantmod package, so I use Quandl for it.

In the ‘search’ box, type for example: “bond total return index” and choose the series you want to work with. In order to load the chosen series to your software using the API, you can use the token (which is just a serial number) attached to your Quandl account, you can find yours here if you’re signed in: http://www.quandl.com/users/info.

library(Quandl)                 # Quandl package
Quandl.auth('here the token copied from the tab')
AAA <- Quandl("ML/AAATRI",start_date="1990-01-01",end_date="2012-12-31",
collapse='monthly')
TR <- Quandl("SANDP/MONRETS",start_date="1990-01-01",end_date="2012-12-31" )
 class(AAA)
# [1] "data.frame"
 class(AAA[,2])
# [1] "numeric"
 class(AAA[,1])
# [1] "Date"

As you can see, the data comes in the correct format. Columns which are quotes are class numeric and the date vector is class Date. You have the "collapse" argument for getting your preferred frequency and some other arguments, like "sort" which will reverse the chronological order. To view the full list of options type '?Quandl' in the console.

What is loaded is the AAA index managed by Merrill Lynch and the total returns on the S&P. Total return means that we invest back any payments (such as dividends) we get from the companies. Let's look at the series:

Time <- rev(TR[,1]) 
TR <- apply(TR[-1],2,rev) 
# We now pretend as if we invested 1 dollar in 1990.
bond <- rev(AAA[,2])/tail(AAA[,2],1) 
stock <- NULL
for (i in 1:NROW(TR)){
stock[i] <- cumsum(prod((1+TR[1:i,11])))
}
# Graphical Parameters:
stockframe = data.frame(value=stock,Date=Time)
bondframe = data.frame(value=bond,Date=Time)
line.plot <- ggplot() +
geom_line(data=stockframe, aes(x=Date, y=value, colour="Stocks")) +
geom_line(data=bondframe, aes(x=Date, y=value, colour="Bonds")) +
scale_colour_manual("", breaks = c("Stocks", "Bonds"), values = c("#29779f","#d8593b")) +
theme(panel.background = element_rect(fill='#FFFFFF'), panel.grid.major.x = element_blank(), panel.grid.major.y = element_line(colour='#3a4047', size=0.1), panel.grid.minor = element_line(colour='#3a4047', size=0.1)) +
xlab("Date") + ylab("Returns") + ggtitle("Stocks and Bonds")
line.plot

lineplot

We see that over time stocks deliver higher returns than bonds, which is what we expect given their higher volatility. However, note that there are 'snapshots' in time where investing the one dollar would yield the almost the same return whether it is invested in stocks or bonds. Specifically, investing one dollar in 1990 would pay back 3.5 dollar in 2008.

Let us now dissect this graph and have a look at the yearly performance. We can easily compute yearly returns if we convert the series to another class called ts (time series).

# We convert to time series so later we can compute yearly returns.
AAAA <- ts(rev(AAA[,2]),start=c(1990,1),end=c(2012,1),frequency=12)
stockk <- xts(stock,order.by=Time)
yretb <- yearlyReturn(AAAA)
yrets <- yearlyReturn(stockk)
namarg <- substr(index(yrets),1,4)
df = data.frame(Date=namarg, value=as.numeric(yrets)*100)
df2 = data.frame(Date=namarg, value=as.numeric(yretb)*100)
bar.plot <- ggplot() +
geom_bar(stat='identity', data=df, aes(x=Date, y=value, fill="Stocks")) +
geom_bar(stat='identity', data=df2, aes(x=Date, y=value, fill="Bonds")) + 
scale_fill_manual("", breaks = c("Stocks", "Bonds"), values = c("#29779f","#d8593b")) +
coord_flip() +
theme(panel.background = element_rect(fill='#FFFFFF'), panel.grid.major.x = element_blank(), panel.grid.major.y = element_line(colour='#3a4047', size=0.1), panel.grid.minor = element_line(colour='#3a4047', size=0.1)) +
xlab("Date") + ylab("%") + ggtitle("Yearly Returns")
bar.plot

barplot

These are the yearly return of stocks (blue) and bonds (orange). We see that bonds will never realize those returns sometimes achieved by equities but they are more stable, they are more stable by a large margin. This stability in bond's returns translates to higher sharp ratio.

Let us now check on a yearly basis, what is the SR for different portfolio decomposition, 20-80, 40-60 etc.:

TT <- length(yrets)
bondweight <- c(.2,.4,.6,.8)
l=length(bondweight)
stockweight <- 1-bondweight
Sharp <- m <- v <- NULL
st = 1 # 19 = 2008
for (j in 1:l){
PortRet <- as.numeric(bondweight[j]*yretb[st:TT]) + as.numeric(stockweight[j]*yrets[st:TT])
# you can play around with removing bad equity years.
#PortRet <- as.numeric(bondweight[j]*yretb[-st]) + as.numeric(stockweight[j]*yrets[-st])
m[j] <- mean(PortRet)
v[j] <-sd(PortRet)
Sharp[j] <- m[j]/v[j]
}
Sharp
# 0.666 0.804 1.014 1.260

So, the higher the bond weighting (defined here by the AAA), the higher the SR. Of course, lower absolute returns, but higher returns per unit of variance. SR for 100% bonds is 1.26 which is the highest among the split considered. According to this, if you very much dislike the variance, you should invest fully in bonds and forget about equities. Apart from that, given the first figure it is also very important to realize that you can encounter these 'snapshots' when you basically get nothing for the extra risk you take. You can only hope you are not close to one of these 'snapshots' right before you need your savings back. 60-40 split? perhaps in the far past, not entirely convincing according to recent decades.

 
Appendix
Using Quandl with Matlab is also very easy. You simply need to go here: https://github.com/quandl/Matlab and take the folder named Q+. In it, there are a couple of functions you need. Place the folder (or create a new folder but keep the same name) in your working Matlab directory and you are done:

Quandl.auth('here the token copied from the tab')
AAA = Quandl.get('ML/AAATRI','start_date','1990-01-01','end_date','2012-12-31','collapse','monthly');
TR = Quandl.get('SANDP/MONRETS','start_date','1990-01-01','end_date','2012-12-31');

 
Comments
Performance of bonds have been relatively strong over the last couple of decades. The good performance is directly linked to the interest rate set by the Fed. This rate has been declining over the years and is now very low (so can only move up or stay very low). Because of it, we should not expect a repeat of the strong bond performance we've observed so far.

To leave a comment for the author, please follow the link and comment on his blog: quandl blog » R quandl blog.

R-bloggers.com offers daily e-mail updates about R news and tutorials on topics such as: visualization (ggplot2, Boxplots, maps, animation), programming (RStudio, Sweave, LaTeX, SQL, Eclipse, git, hadoop, Web Scraping) statistics (regression, PCA, time series, trading) and more...

chart with individual signals

$
0
0

(This article was first published on Copula, and kindly contributed to R-bloggers)


Also I'm not to much into Technical Indicators and Chart-Analysis during system development it is sometimes handy to visualize your buy and selllimits in a chart.

The quantmod package provides a nice charting environment and you can select from a bunch of predefined indicators.

However what I would like to have is to display my buy and selllimits in my chart.

This can be achieved using addTA but before we can display the TA we need to write some code.

Just as example I'm using some indicators I have added to the yahoo OHLC Data

for(symbol in portfAsymbols){
x=get(symbol)
tmpATR <- ATR(x[,c(2,3,4)],atrvalue,maType=EMA,wilder=TRUE)
tmpADX <- ADX(x[,c(2,3,4)],n=14,maType=EMA,wilder=TRUE)
tmpSAR <- SAR(x[,c(2,3)],accel=c(0.02,0.2))
tmpBB <-BBands(x[,c(2,3,4)],n=20,sd=2,maType="SMA")
x$atrind <- tmpATR$atr
x$adxind <-tmpADX$ADX
x$sar<-tmpSAR
assign(symbol,x)
}


Now I'm defining my buylimit by adding or subtracting the ATR to yesterdays CLOSE.


atrpos=atrvalue + 2
 buy = matrix (nrow = n, ncol = 1)
 sell = matrix (nrow = n, ncol = 1)
 for( i in atrpos:n ) {
   buy[i,]=as.numeric(Cl(x[i-1,]))+ as.numeric(round(x$atrind[i-1,],2))
   sell[i,]=as.numeric(Cl(x[i-1,]))- as.numeric(round(x$atrind[i-1,],2))
  
 }


And finally we can now display this buy and selllimit on the chart.

 addTA (as.xts(sell,as.Date(index(x))),on=1,col=7)
 addTA (as.xts(buy,as.Date(index(x))),on=1,col=4)


here is the result


To leave a comment for the author, please follow the link and comment on his blog: Copula.

R-bloggers.com offers daily e-mail updates about R news and tutorials on topics such as: visualization (ggplot2, Boxplots, maps, animation), programming (RStudio, Sweave, LaTeX, SQL, Eclipse, git, hadoop, Web Scraping) statistics (regression, PCA, time series, trading) and more...

Calendar Strategy: Month End

$
0
0

(This article was first published on Systematic Investor » R, and kindly contributed to R-bloggers)

Calendar Strategy is a very simple strategy that buys an sells at the predetermined days, known in advance. Today I want to show how we can easily investigate performance at and around Month End days.

First let’s load historical prices for SPY from Yahoo Fiance and compute SPY perfromance at the month-ends. I.e. strategy will open long position at the close on the 30th and sell position at the close on the 31st.

###############################################################################
# Load Systematic Investor Toolbox (SIT)
# http://systematicinvestor.wordpress.com/systematic-investor-toolbox/
###############################################################################
setInternet2(TRUE)
con = gzcon(url('http://www.systematicportfolio.com/sit.gz', 'rb'))
    source(con)
close(con)
	#*****************************************************************
	# Load historical data
	#****************************************************************** 
	load.packages('quantmod')
		
	tickers = spl('SPY')
		
	data <- new.env()
	getSymbols.extra(tickers, src = 'yahoo', from = '1980-01-01', env = data, set.symbolnames = T, auto.assign = T)
		for(i in data$symbolnames) data[[i]] = adjustOHLC(data[[i]], use.Adjusted=T)
	bt.prep(data, align='keep.all', fill.gaps = T)

	#*****************************************************************
	# Setup
	#*****************************************************************
	prices = data$prices
		n = ncol(prices)
		
	models = list()
		
	period.ends = date.month.ends(data$dates, F)
		
	#*****************************************************************
	# Strategy
	#*****************************************************************
	key.date = NA * prices
		key.date[period.ends] = T
	
	universe = prices > 0
	signal = key.date

	data$weight[] = NA
		data$weight[] = ifna(universe & key.date, F)
	models$T0 = bt.run.share(data, do.lag = 0, trade.summary=T, clean.signal=T) 

Please note that above, in the bt.run.share call, I set do.lag parameter equal to zero (the default value for the do.lag parameter is one). The reason for default setting equal to one is due to signal (decision to trade) is derived using all information available today, so the position can only be implement next day. I.e.

portfolio.returns = lag(signal, do.lag) * returns = lag(signal, 1) * returns

However, in case of the calendar strategy there is no need to lag signal because the trade day is known in advance. I.e.

portfolio.returns = lag(signal, do.lag) * returns = signal * returns

Next, I created two functions to help with signal creation and strategy testing:

	calendar.strategy <- function(data, signal, universe = data$prices > 0) {
		data$weight[] = NA
			data$weight[] = ifna(universe & signal, F)
		bt.run.share(data, do.lag = 0, trade.summary=T, clean.signal=T)  	
	}
	
	calendar.signal <- function(key.date, offsets = 0) {
		signal = mlag(key.date, offsets[1])
		for(i in offsets) signal = signal | mlag(key.date, i)
		signal
	}

	# Trade on key.date
	models$T0 = calendar.strategy(data, key.date)

	# Trade next day after key.date
	models$N1 = calendar.strategy(data, mlag(key.date,1))
	# Trade two days next(after) key.date
	models$N2 = calendar.strategy(data, mlag(key.date,2))

	# Trade a day prior to key.date
	models$P1 = calendar.strategy(data, mlag(key.date,-1))
	# Trade two days prior to key.date
	models$P2 = calendar.strategy(data, mlag(key.date,-2))
	
	# Trade: open 2 days before the key.date and close 2 days after the key.date
	signal = key.date | mlag(key.date,-1) | mlag(key.date,-2) | mlag(key.date,1) | mlag(key.date,2)
	models$P2N2 = calendar.strategy(data, signal)

	# same, but using helper function above	
	models$P2N2 = calendar.strategy(data, calendar.signal(key.date, -2:2))
		
	strategy.performance.snapshoot(models, T)
	
	strategy.performance.snapshoot(models, control=list(comparison=T), sort.performance=F)

Above, T0 is a calendar strategy that buys on 30th and sells on 31st. I.e. position is only held on a month end day. P1 and P2 are two strategies that buy a day prior and two days prior correspondingly. N1 and N2 are two strategies that buy a day after and two days after correspondingly.

plot1

plot2

The N1 strategy, buy on 31st and sell on the 1st next month seems to be working best for SPY.

Finally, let’s look at the actual trades:


	last.trades <- function(model, n=20, make.plot=T, return.table=F) {
		ntrades = min(n, nrow(model$trade.summary$trades))		
		trades = last(model$trade.summary$trades, ntrades)
		if(make.plot) {
			layout(1)
			plot.table(trades)
		}	
		if(return.table) trades	
	}
	
	last.trades(models$P2)

plot3

The P2 strategy enters position at the close 3 days before the month end and exits positions at the close 2 days before the month end. I.e. the performance is due to returns only 2 days before the month end.

With this post I wanted to show how easily we can study calendar strategy performance using the Systematic Investor Toolbox.

Next, I will demonstrate calendar strategy applications to variety of important dates.

To view the complete source code for this example, please have a look at the bt.calendar.strategy.month.end.test() function in bt.test.r at github.


To leave a comment for the author, please follow the link and comment on his blog: Systematic Investor » R.

R-bloggers.com offers daily e-mail updates about R news and tutorials on topics such as: visualization (ggplot2, Boxplots, maps, animation), programming (RStudio, Sweave, LaTeX, SQL, Eclipse, git, hadoop, Web Scraping) statistics (regression, PCA, time series, trading) and more...

Calendar Strategy: Option Expiry

$
0
0

(This article was first published on Systematic Investor » R, and kindly contributed to R-bloggers)

Today, I want to follow up with the Calendar Strategy: Month End post. Let’s examine the perfromance Option Expiry days as presented in the The Mooost Wonderful Tiiiiiiime of the Yearrrrrrrrr! post.

First, I created two convenience functions for creating a calendar signal and back-testing calendar strategy: calendar.signal and calendar.strategy functions are in the strategy.r at github

Now, let’s dive in and examine historical perfromance of SPY during Option Expiry period in December:

###############################################################################
# Load Systematic Investor Toolbox (SIT)
# http://systematicinvestor.wordpress.com/systematic-investor-toolbox/
###############################################################################
setInternet2(TRUE)
con = gzcon(url('http://www.systematicportfolio.com/sit.gz', 'rb'))
    source(con)
close(con)

	#*****************************************************************
	# Load historical data
	#****************************************************************** 
	load.packages('quantmod')
		
	tickers = spl('SPY')
		
	data <- new.env()
	getSymbols.extra(tickers, src = 'yahoo', from = '1980-01-01', env = data, set.symbolnames = T, auto.assign = T)
		for(i in data$symbolnames) data[[i]] = adjustOHLC(data[[i]], use.Adjusted=T)
	bt.prep(data, align='keep.all', fill.gaps = T)

	#*****************************************************************
	# Setup
	#*****************************************************************
	prices = data$prices
		n = ncol(prices)
		
	dates = data$dates	
	
	models = list()
	
	universe = prices > 0
		
	# Find Friday before options expiration week in December
	years = date.year(range(dates))
	second.friday = third.friday.month(years[1]:years[2], 12) - 7
		key.date.index = na.omit(match(second.friday, dates))
				
	key.date = NA * prices
		key.date[key.date.index,] = T

	#*****************************************************************
	# Strategy: Op-ex week in December most bullish week of the year for the SPX
	#   Buy: December Friday prior to op-ex.
	#   Sell X days later: 100K/trade 1984-present
	# http://quantifiableedges.blogspot.com/2011/12/mooost-wonderful-tiiiiiiime-of.html
	#*****************************************************************
	signals = list(T0=0)
		for(i in 1:15) signals[[paste0('N',i)]] = 0:i	
	signals = calendar.signal(key.date, signals)
	models = calendar.strategy(data, signals, universe = universe)
	    
	strategy.performance.snapshoot(models, T, sort.performance=F)

plot1

Strategies vary in perfromance, next let’s examine a bit more details

	# custom stats	
	out = sapply(models, function(x) list(
		CAGR = 100*compute.cagr(x$equity),
		MD = 100*compute.max.drawdown(x$equity),
		Win = x$trade.summary$stats['win.prob', 'All'],
		Profit = x$trade.summary$stats['profitfactor', 'All']
		))	
	performance.barchart.helper(out, sort.performance = F)
	
	# Plot 15 day strategy
	strategy.performance.snapshoot(models$N15, control=list(main=T))
	
	# Plot trades for 15 day strategy
	last.trades(models$N15)
	
	# Make a summary plot of trades for 15 day strategy
	trades = models$N15$trade.summary$trades
		trades = make.xts(parse.number(trades[,'return']), as.Date(trades[,'entry.date']))
	layout(1:2)
		par(mar = c(4,3,3,1), cex = 0.8) 
	barplot(trades, main='Trades', las=1)
	plot(cumprod(1+trades/100), type='b', main='Trades', las=1)

Details for the 15 day strategy:
plot2

plot3

plot4

plot5

With this post I wanted to show how easily we can study calendar strategy performance using the Systematic Investor Toolbox.

Next, I will look at the importance of the FED meeting days.

To view the complete source code for this example, please have a look at the
bt.calendar.strategy.option.expiry.test() function in bt.test.r at github.


To leave a comment for the author, please follow the link and comment on his blog: Systematic Investor » R.

R-bloggers.com offers daily e-mail updates about R news and tutorials on topics such as: visualization (ggplot2, Boxplots, maps, animation), programming (RStudio, Sweave, LaTeX, SQL, Eclipse, git, hadoop, Web Scraping) statistics (regression, PCA, time series, trading) and more...

Calendar Strategy: Fed Days

$
0
0

(This article was first published on Systematic Investor » R, and kindly contributed to R-bloggers)

Today, I want to follow up with the Calendar Strategy: Option Expiry post. Let’s examine the importance of the FED meeting days as presented in the Fed Days And Intermediate-Term Highs post.

Let’s dive in and examine historical perfromance of SPY during FED meeting days:

###############################################################################
# Load Systematic Investor Toolbox (SIT)
# http://systematicinvestor.wordpress.com/systematic-investor-toolbox/
###############################################################################
setInternet2(TRUE)
con = gzcon(url('http://www.systematicportfolio.com/sit.gz', 'rb'))
    source(con)
close(con)
	#*****************************************************************
	# Load historical data
	#****************************************************************** 
	load.packages('quantmod')
		
	tickers = spl('SPY')
		
	data <- new.env()
	getSymbols.extra(tickers, src = 'yahoo', from = '1980-01-01', env = data, set.symbolnames = T, auto.assign = T)
		for(i in data$symbolnames) data[[i]] = adjustOHLC(data[[i]], use.Adjusted=T)
	bt.prep(data, align='keep.all', fill.gaps = T)

	#*****************************************************************
	# Setup
	#*****************************************************************
	prices = data$prices
		n = ncol(prices)
		
	dates = data$dates	
	
	models = list()
	
	universe = prices > 0
		# 100 day SMA filter
		universe = universe & prices > SMA(prices,100)
		
	# Find Fed Days
	info = get.FOMC.dates(F)
		key.date.index = na.omit(match(info$day, dates))
	
	key.date = NA * prices
		key.date[key.date.index,] = T
		
	#*****************************************************************
	# Strategy
	#*****************************************************************
	signals = list(T0=0)
		for(i in 1:15) signals[[paste0('N',i)]] = 0:i	
	signals = calendar.signal(key.date, signals)
	models = calendar.strategy(data, signals, universe = universe)

	strategy.performance.snapshoot(models, T, sort.performance=F)

plot1

Please note 100 day moving average filter above. If we take it out, the performance deteriorates significantly.

	# custom stats	
	out = sapply(models, function(x) list(
		CAGR = 100*compute.cagr(x$equity),
		MD = 100*compute.max.drawdown(x$equity),
		Win = x$trade.summary$stats['win.prob', 'All'],
		Profit = x$trade.summary$stats['profitfactor', 'All']
		))	
	performance.barchart.helper(out, sort.performance = F)
	
	strategy.performance.snapshoot(models$N15, control=list(main=T))
	
	last.trades(models$N15)
	
	trades = models$N15$trade.summary$trades
		trades = make.xts(parse.number(trades[,'return']), as.Date(trades[,'entry.date']))
	layout(1:2)
		par(mar = c(4,3,3,1), cex = 0.8) 
	barplot(trades, main='N15 Trades', las=1)
	plot(cumprod(1+trades/100), type='b', main='N15 Trades', las=1)

N15 Strategy:

plot2

plot3

plot4

plot5

With this post I wanted to show how easily we can study calendar strategy performance using the Systematic Investor Toolbox.

Next, I will look at the importance of the Dividend days.

To view the complete source code for this example, please have a look at the bt.calendar.strategy.fed.days.test() function in bt.test.r at github.


To leave a comment for the author, please follow the link and comment on his blog: Systematic Investor » R.

R-bloggers.com offers daily e-mail updates about R news and tutorials on topics such as: visualization (ggplot2, Boxplots, maps, animation), programming (RStudio, Sweave, LaTeX, SQL, Eclipse, git, hadoop, Web Scraping) statistics (regression, PCA, time series, trading) and more...

Twinkle,twinkle little STAR

$
0
0

(This article was first published on unstarched» R, and kindly contributed to R-bloggers)

At the recent R/Finance 2014 conference in Chicago I gave a talk on Smooth Transition AR models and a new package for estimating them called twinkle. In this blog post I will provide a short outline of the models and an introduction to the package and its features.

Financial markets have a strong cyclical component linked to the business cycle, and may undergo temporary or permanent shifts related to both endogenous and exogenous shocks. As a result, the distribution of returns is likely to be different depending on which state of the world we are in. It is therefore advantageous to model such dynamics within a framework which can accommodate and explain these different states. Within time series econometrics, the switching between states has been based either on unobserved components, giving rise to the Markov Switching (MS) models introduced by Hamilton (1989), or observed components leading to Threshold type Autoregressive (TAR) models popularized by Tong (1980). This post and the accompanying package it introduces considers only observed component switching, though there are a number of good packages in R for Markov Switching.

The Smooth Transition AR Model

The smooth transition AR model was introduced in Teräsvirta (1994), and has been used in numerous studies from GDP modelling to Forex and Equity market volatility. See the presentation from the talk above which includes a number of selected references.

The s-state model considered in the twinkle package takes the following form:
\[
{y_t} = \sum\limits_{i = 1}^s {\left[ {\left( {{{\phi '}_i}y_t^{\left( p \right)} + {{\xi '}_i}{x_t} + {{\psi '}_i}e_t^{\left( q \right)}} \right){F_i}\left( {{z_{t - d}};{\gamma _i},{\alpha _i},{c_i},{\beta _i}} \right)} \right]} + {\varepsilon _t}
\]
where:
\[
\begin{gathered}
y_t^{\left( p \right)} = {\left( {1,\tilde y_t^{\left( p \right)}} \right)^\prime },\quad \tilde y_t^{\left( p \right)} = {\left( {{y_{t - 1}}, \ldots ,\quad {y_{t - p}}} \right)^\prime },{\phi _i} = {\left( {{\phi _{i0}},{\phi _{i1}}, \ldots ,\quad {\phi _{ip}}} \right)^\prime } \\
\varepsilon _t^{\left( q \right)} = {\left( {{\varepsilon _{t - 1}}, \ldots ,\quad {\varepsilon _{t - q}}} \right)^\prime },{{\psi '}_i} = {\left( {{\psi _{i1}}, \ldots ,{\psi _{iq}}} \right)^\prime }\\
{x_t}{\text{ }} = {\left( {{x_1}, \ldots ,{x_l}} \right)^\prime },\quad {{\xi '}_i}{\text{ }} = {\left( {{\xi _{i1}}, \ldots ,{\xi _{il}}} \right)^\prime } \\
\end{gathered}
\]
and we allow for variance mixture so that \( {\varepsilon _t} \sim iid\left( {0,{\sigma _i},\eta } \right) \) with \( \eta \) denoting any remaining distributional parameters which are common across states. The softmax function is used to model multiple states such that:
\[
\begin{gathered}
{F_i}\left( {{z_{t - d}};{\gamma _i},{\alpha _i},{c_i},{\beta _i}} \right) = \frac{{{e^{{\pi _{i,t}}}}}}
{{1 + \sum\limits_{i = 1}^{s - 1} {{e^{{\pi _{i,t}}}}} }} \\
{F_s}\left( {{z_{t - d}};{\gamma _i},{\alpha _i},{c_i},{\beta _i}} \right) = \frac{1}
{{1 + \sum\limits_{i = 1}^{s - 1} {{e^{{\pi _{i,t}}}}} }}\\
\end{gathered}
\]
where the state dynamics \( \pi_{i,t} \) also include the option of lag-1 autoregression:
\[
{\pi _{i,t}} = {\gamma _i}\left( {{{\alpha '}_i}{z_{t - d}} - {c_i}} \right) + {{\beta '}_i}{\pi _{i,t - 1}},\quad \gamma_i>0
\]
with initialization conditions given by:

\[\pi _{i,0} = \frac{{{\gamma _i}\left( {{{\alpha '}_i}\bar z - {c_i}} \right)}}{{1 - {\beta _i}}},\quad \beta<1\]

The parameter \( \gamma_i \) is a scaling variable determining the smoothness of the transition between states, while \( c_i \) is the threshold intercept about which switching occurs.

The transition variable(s) \( z_t \) may be a vector of external regressors each with its own lag, or a combination of lags of \( y_t \) in which case the model is ‘rudely’, as one participant in the conference noted, called ‘self-exciting’. Should \( z_t \) be a vector, then for identification purposes \( \alpha_1 \) is fixed to 1. Additionally, as will be seen later, it is also possible to pass a function \( f\left(.\right) \) which applies a custom transformation to the lagged values in the case of the self-exciting model. While it may appear at first that the same can be achieved by pre-transforming those values and passing the transformed variables in the switching equation, this leaves you dead in the water when it comes to s(w)imulation and n-ahead forecasting where the value of the transition variable depends on the lagged simulated of that same variable.

Finally, the transition function \( F_i \) has usually been taken to be the logistic or exponential transform functions. As the 2 figures below illustrate, the logistic nests the TAR model as \( \gamma_i\to \infty \) and collapses to the linear case as \( \gamma_i\to 0 \). The exponential on the other hand collapses to the linear case as \( \gamma_i \) approaches the limits and has a symmetric shape which is sometimes preferred for exchange rate modelling because of the perceived symmetric exchange rate adjustment behavior. Currently, only the logistic is considered in the twinkle package.

Logistic Transition

Logistic Transition

Exponential Transition

Exponential Transition


Implementation

I follow a similar construction paradigm for the twinkle package as I have in my other packages. Namely, an S4 framework which includes steps for specifying the model, estimation, inference and tests, visual diagnostics, filtering, forecasting, simulation and rolling estimation/forecasting. I consider these to be the minimum methods for creating a complete modelling environment for econometric analysis. Additional methods are summarized in the following table:

Method
Description
Class
Example
setfixed<-Set fixed parameters[1]>setfixed(spec)<-list(s1.phi0=0)
setstart<-Set starting parameters[1]>setstart(spec)<-list(s1.phi0=0)
setbounds<-Set parameter bounds[1]>setbounds(spec)<-list(s1.phi0=c(0,1))
nonlinearTestLuukkonen Test[1][2]>nonlinearTest(fit, robust=TRUE)
modelmatrixmodel matrix[1][2]>modelmatrix(fit, linear=FALSE)
coefcoef vector[2][3]>coef(fit)
fittedconditional mean[2][3][4][5][6]>fitted(fit)
residualsresiduals>residuals(fit)
statesconditional state probabilities[2][3][4][5][6]>states(fit)
likelihoodlog likelihood[2][3]>likelihood(fit)
infocriterianormalized information criteria[2][3][7]>infocriteria(fit)
vcovparameter covariance matrix[2]>vcov(fit)
convergencesolver convergence[2][7]>convergence(fit)
scorenumerical score matrix[2]>score(fit)
sigmaconditional sigma[2][3][4][5][6]>sigma(fit)
as.data.frameconditional density[7]>as.data.frame(roll)
quantileconditional quantiles[2][3][4][5][6][7]>quantile(fit)
pitconditional probability integral transformation[2][3][7]>pit(fit)
showsummary[1][2][3][4][5][6][7]>fit

The classes in column 3 are: [1] STARspec, [2] STARfit, [3] STARfilter, [4] STARforecast, [5] STARsim, [6] STARpath, [7] rollSTAR.

Model Specification

The model specification function has a number of options which I will briefly discuss in the section.

args(starspec)
#
## function (mean.model = list(states = 2, include.intercept = c(1,
##     1), arOrder = c(1, 1), maOrder = c(0, 0), matype = 'linear',
##     statevar = c('y', 's'), s = NULL, ylags = 1, statear = FALSE,
##     yfun = NULL, xreg = NULL, transform = 'logis'), variance.model = list(dynamic = FALSE,
##     model = 'sGARCH', garchOrder = c(1, 1), submodel = NULL,
##     vreg = NULL, variance.targeting = FALSE), distribution.model = 'norm',
##     start.pars = list(), fixed.pars = list(), fixed.prob = NULL,
##     ...)
##
Mean Equation

Upto 4 states may be modelled, with a choice of setting the inclusion or exclusion of an intercept in each state (include.intercept), the number of AR (arOrder) and MA (maOrder) parameters per state and whether to include external regressors in each state (xreg should be a prelagged xts matrix). Note that the default for the moving average terms is to include them outside the states, but this can be changed by setting matype=’states’. The statevar denotes what the state variable is, with “y” being the self-exciting model and “s” a set of external regressors passed as a prelagged xts matrix to s. If the choice is “y”, the ylags should be a vector of the lags for the variable with a choice like c(1,3) denoting lag-1 and lag-3. Finally, the yfun option was discussed in the previous section and is a custom transformation function for y returning the same number of points as given.

Variance Equation

The variance can be either static (default) or dynamic (logical), in which case it can be one of 3 GARCH models (‘sGARCH’,’gjrGARCH’ or ‘eGARCH’) or ‘mixture’ as discussed previously. The rest of the options follow from those in the rugarch package in the case of GARCH type variance.

Other options

The same distributions as those in rugarch are implemented, and there is the option of passing fixed or starting parameters to the specification, although the methods ‘setfixed< -‘ and ‘setstart<-‘ allow this to be set once the specification has been formed. There is also a ‘setbounds<-‘ method for setting parameter bounds which for the unconstrained solvers (the default to use with this type of model) means using a logistic bounding transformation. Finally, the fixed.probs option allows the user to pass a set of fixed state probabilities as an xts matrix in which case the model is effectively linear and may be estimated quite easily.

Parameter naming

It is probably useful to have the naming convention of the parameters used in the package should starting, fixed or bounds need to be set. These are summarized in the list below and generally follow the notation used in the representation of the model in the previous section:

  • All state based variables are preceded by their state number (s1.,s2.,s3.,s4.)
  • Conditional Mean Equation:
    • intercept: phi0 (e.g. s1.phi0, s2.phi0)
    • AR(p): phi1, …, phip (e.g. s1.phi1, s1.phi2, s2.phi1, s2.phi2)
    • MA(q): psi1, …, psiq (e.g. s1.psi1, s1.psi2, s2.psi1, s2.psi2). Note that in the case of matype=’linear’, the states are not used.
    • X(l): xi1, …, xil (e.g. s1.xi1, s2.xi2, x3.xi1)
  • State Equation:
    • scaling variable: gamma (e.g. s1.gamma)
    • Threshold: c (e.g. s1.c)
    • Threshold Variables (k): alpha2, …, alphak (e.g. s1.alpha2, s1.alpha3). Note that the first variable (alpha1) is constrained to be 1 for identification purposes so cannot be changed. This will always show up in the summary with NAs in the standard errors since it is not estimated.
    • Threshold AR(1): beta (e.g. s1.beta)
  • Variance Equation:
    • sigma (s): If dynamic and mixture then s1.sigma, s2.sigma etc. If static then just sigma.
    • GARCH parameters follow same naming as in the rugarch package
  • Distribution:
    • skew
    • shape

I’ll define a simple specification to use with this post and based on examples from the twinkle.tests folder in the src distribution (under the inst folder). This is based on a weekly realized measure of the Nasdaq 100 index for the period 02-01-1996 to 12-10-2001, and the specification is for a simple lag-1 self-exciting model with AR(2) for each state.

require(quantmod)
data(ndx)
ndx.ret2 = ROC(Cl(ndx), na.pad = FALSE)^2
ndx.rvol = sqrt(apply.weekly(ndx.ret2, FUN = 'sum'))
colnames(ndx.rvol) = 'RVOL'
spec = starspec(mean.model = list(states = 2, arOrder = c(2, 2), statevar = 'y',
    ylags = 1))

Before proceeding, I also check the presence of STAR nonlinearity using the test of Luukkonen (1988) which is implemented in the nonlinearTest method with an option for also testing with robust assumption (to heteroscedasticity):

tmp1 = nonlinearTest(spec, data = log(ndx.rvol))
tmp2 = nonlinearTest(spec, data = log(ndx.rvol), robust = TRUE)
testm = matrix(NA, ncol = 4, nrow = 2, dimnames = list(c('Standard', 'Robust'),
    c('F.stat', 'p.value', 'Chisq.stat', 'p.value')))
testm[1, ] = c(tmp1$F.statistic, tmp1$F.pvalue, tmp1$chisq.statistic, tmp1$chisq.pvalue)
testm[2, ] = c(tmp2$F.statistic, tmp2$F.pvalue, tmp2$chisq.statistic, tmp2$chisq.pvalue)
print(testm, digit = 5)
##
##          F.stat   p.value Chisq.stat   p.value
## Standard 3.7089 0.0014366     21.312 0.0016123
## Robust   2.5694 0.0193087     15.094 0.0195396

We can safely reject the linearity assumption under the standard test at the 1% significance level, and under the robust assumption at the 5% significance level. Note that this example is taken from the excellent book of Zivot (2007) (chapter on nonlinear models) and the numbers should also agree with what is printed there.

Model Estimation

Estimating STAR models is a challenging task, and for this purpose a number of options have been included in the package.

args(starfit)
#
## function (spec, data, out.sample = 0, solver = 'optim', solver.control = list(),
##     fit.control = list(stationarity = 0, fixed.se = 0, rec.init = 'all'),
##     cluster = NULL, n = 25, ...)
## NULL

The data must be an xts object with the same time indices as any data already passed to the STARspec object and contain only numeric data without any missing values. The out.sample is used to indicate how many data points to optionally leave out in the estimation (from the end of the dataset) for use in out-of-sample forecasting later on when the estimated object is passed to the starfilter routine. Perhaps the most important choice to be made is the type of solver to use and it’s control parameters solver.control which should not be omitted. The following solvers and ‘strategies’ are included:

  • optim. The preferred choice is the BFGS solver. The choice of solver is controlled by the method option in the solver.control list. All parameter bounds are enforced through the use of a logistic transformation.
  • nlminb. Have had little luck getting the same performance as the BFGS solver.
  • solnp. Will most likely find a local solution.
  • cmaes. Even though it is a global solver, it requires careful tweaking of the control parameters (and there are many). This is the parma package version of the solver.
  • deoptim. Another global solver. May be slow and require tweaking of the control parameters.
  • msoptim. A multistart version of optim with option for using the cluster option for parallel evaluation. The number of multi-starts is controlled by the n.restarts option in the solver.control list.
  • strategy. A special purpose optimization strategy for STAR problems using the BFGS solver. It cycles between keeping the state variables fixed and estimating the linear variables (conditional mean, variance and any distribution parameters), keeping the linear variables fixed and estimating the state variables, and a random re-start optimization to control for possibly local solutions. The argument n in the routine controls the number of times to cycle through this strategy. The solver.control list should pass control arguments for the BFGS solver. This is somewhat related to concentrating the sum of squares methodology in terms of the estimation strategy, but does not minimize the sum of squares, opting instead for a proper likelihood evaluation.

The strategy and msoptim solver strategies should be the preferred choice when estimating STARMA models.

I continue with the example already covered in the specification section and estimate the model, leaving 50 points for out of sample forecasting and filtering later on:

mod = starfit(spec, data = log(ndx.rvol), out.sample = 50, solver = 'strategy',
    n = 8, solver.control = list(alpha = 1, beta = 0.4, gamma = 1.4, reltol = 1e-12))
show(mod)
plot(mod)
#
##
## *---------------------------------*
## *          STAR Model Fit         *
## *---------------------------------*
## states       : 2
## statevar     : y
## statear      : FALSE
## variance     : static
## distribution : norm
##
##
## Optimal Parameters (Robust Standard Errors)
## ------------------------------------
##            Estimate  Std. Error    t value Pr(>|t|)
## s1.phi0    -3.54380    0.034260 -103.43760 0.000000
## s1.phi1    -0.64567    0.426487   -1.51393 0.130043
## s1.phi2     0.10950    0.319605    0.34262 0.731886
## s2.phi0    -2.51982    0.849927   -2.96475 0.003029
## s2.phi1     0.10902    0.214009    0.50944 0.610444
## s2.phi2     0.17944    0.062210    2.88447 0.003921
## s1.gamma    3.22588    1.941072    1.66190 0.096532
## s1.c       -2.52662    0.347722   -7.26620 0.000000
## s1.alpha1   1.00000          NA         NA       NA
## sigma       0.39942    0.019924   20.04776 0.000000
##
## LogLikelihood : -126.3
##
## Akaike       1.0738
## Bayes        1.1999
## Shibata      1.0714
## Hannan-Quinn 1.1246
##
## r.squared         :  0.3167
## r.squared (adj)   :  0.2913
## RSS               :  40.2
## skewness (res)    :  -0.235
## ex.kurtosis (res) :  0.4704
##
## AR roots
##         Moduli1 Moduli2
## state_1   1.274   7.170
## state_2   2.076   2.684
fitplot

plot(mod)


Model Filtering

Filtering a dataset with an already estimated set of parameters has been already extensively discussed in related blog on the rugarch package. The method takes the following arguments:

args(starfilter)
##
## function (spec, data, out.sample = 0, n.old = NULL, rec.init = 'all', ...)
##

The most important argument is probably n.old and denotes, in the case that the new dataset is composed of the old dataset on which estimation took place and the new data, the number of points composing the original dataset. This is so as to use the same initialization values for certain recursions and return the exact same results for those points in the original dataset. The following example illustrates:

specf = spec
setfixed(specf) < - as.list(coef(mod))
N = nrow(ndx.rvol) - 50
modf = starfilter(specf, data = log(ndx.rvol), n.old = N)
print(all.equal(fitted(modf)[1:N], fitted(mod)))
## [1] TRUE
print(all.equal(states(modf)[1:N], states(mod)))
## [1] TRUE


Model Forecasting

Nonlinear models are considerable more complex than their linear counterparts to forecast. For 1-ahead this is quite simple, but for n-ahead there is no closed form solution as in the linear case. Consider a general nonlinear first order autoregressive model:
\[
{y_t} = F\left( {{y_{t - 1}};\theta } \right) + {\varepsilon _t}
\]
The 1-step ahead forecast is simply:
\[
{{\hat y}_{t + 1\left| t \right.}} = E\left[ {{y_{t + 1}}\left| {{\Im _t}} \right.} \right] = F\left( {{y_t};\theta } \right)
\]
However, for n-step ahead, and using the Chapman-Kolmogorov relationship \( g\left( {{y_{t + h}}\left| {{\Im _t}} \right.} \right) = \int_{ – \infty }^\infty {g\left( {{y_{t + h}}\left| {{y_{t + h – 1}}} \right.} \right)g\left( {{y_{t + h – 1}}\left| {{\Im _t}} \right.} \right)d{y_{t + h – 1}}} \), we have:
\[E\left[ {{y_{t + h}}\left| {{\Im _t}} \right.} \right] = \int_{ – \infty }^\infty  {E\left[ {{y_{t + h}}\left| {{y_{t + h - 1}}} \right.} \right]g\left( {{y_{t + h – 1}}\left| {{\Im _t}} \right.} \right)d{y_{t + h – 1}}}\]
where there is no closed form relationship since \( E\left[ {F\left( . \right)} \right] \ne F\left({E\left[ . \right]} \right) \).
The trick is to start at h=2:
\[
{{\hat y}_{t + 2\left| t \right.}} = \frac{1}{T}\sum\limits_{i = 1}^T {F\left( {{{\hat y}_{t + 1\left| t \right.}} + {\varepsilon _i};\theta } \right)}
\]
and using either quadrature integration or monte carlo summation obtain the expected value. Use that value for the next step, rinse and repeat.

In the twinkle package, both quadrature and monte carlo summation are options in the starforecast method:

args(starforecast)
#
## function (fitORspec, data = NULL, n.ahead = 1, n.roll = 0, out.sample = 0,
##     external.forecasts = list(xregfor = NULL, vregfor = NULL,
##         sfor = NULL, probfor = NULL), method = c('an.parametric',
##         'an.kernel', 'mc.empirical', 'mc.parametric', 'mc.kernel'),
##     mc.sims = NULL, ...)
## NULL

with added options for either parametric, empirical or kernel fitted distribution for the residuals. The method also allows for multiple dispatch methods by taking either an object of class STARfit or one of class STARspec (with fixed parameters and a dataset). The example below illustrates the different methods:

forc1 = starforecast(mod, n.roll = 2, n.ahead = 20, method = 'an.parametric',
    mc.sims = 10000)
forc2 = starforecast(mod, n.roll = 2, n.ahead = 20, method = 'an.kernel', mc.sims = 10000)
forc3 = starforecast(mod, n.roll = 2, n.ahead = 20, method = 'mc.empirical',
    mc.sims = 10000)
forc4 = starforecast(mod, n.roll = 2, n.ahead = 20, method = 'mc.parametric',
    mc.sims = 10000)
forc5 = starforecast(mod, n.roll = 2, n.ahead = 20, method = 'mc.kernel', mc.sims = 10000)
show(forc1)
par(mfrow = c(2, 3))
plot(forc1)
plot(forc2)
plot(forc3)
plot(forc4)
plot(forc5)
#
##
## *------------------------------------*
## *        STAR Model Forecast         *
## *------------------------------------*
## Horizon        : 20
## Roll Steps     : 2
## STAR forecast  : an.parametric
## Out of Sample  : 20
##
## 0-roll forecast [T0=2000-10-27]:
##      Series
## T+1  -2.684
## T+2  -2.820
## T+3  -2.948
## T+4  -3.061
## T+5  -3.157
## T+6  -3.231
## T+7  -3.286
## T+8  -3.324
## T+9  -3.350
## T+10 -3.368
## T+11 -3.379
## T+12 -3.387
## T+13 -3.392
## T+14 -3.395
## T+15 -3.397
## T+16 -3.398
## T+17 -3.399
## T+18 -3.400
## T+19 -3.400
## T+20 -3.400

forcplot

The nice thing about the monte carlo method is that the density of each point forecast is now available, and used in the plot method to draw quantiles around that forecast. It can be extracted by looking at the slot object@forecast$yDist, which is list of length n.roll+1 of matrices of dimensions mc.sims by n.ahead.


Model Simulation

Simulation in the twinkle package, like in rugarch, can be carried out directly on the estimated STARfit object else on a specification object of class STARspec with fixed parameters. Achieving equivalence between the two relates to start-up initialization conditions and is always a good check on reproducibility and code correctness, and shown in the example that follows:

sim = starsim(mod, n.sim = 1000, rseed = 10)
path = starpath(specf, n.sim = 1000, prereturns = tail(log(ndx.rvol)[1:N], rseed = 10)
all.equal(fitted(sim), fitted(path))
## TRUE
all.equal(states(sim), states(path))
## TRUE

The fitted method extracts the simulated series as an n.sim by m.sim matrix, while the states method extracts the simulated state probabilities (optionally takes “type” argument with options for extracting the simulated raw dynamics or conditional simulated mean per state) and can be passed the argument sim to indicate which m.sim run to extract (default: 1). Passing the correct prereturns value and the same seed as in starsim, initializes the simulation from the same values as the test of equality shows between the 2 methods. Things become a little more complicated when using external regressors or GARCH dynamics, but with careful preparation the results with again be the same.

Rolling estimation and 1-step ahead forecasting

The final key modelling method, useful for backtesting, is that of the rolling estimation and 1-step ahead forecasting which has a number of options to define the type of estimation window to use as well as a resume method which re-estimates any windows which did not converge during the original run. This type of method has already been covered in related posts of rugarch so I will reserve a more in-depth demo for a later date.

Final Thoughts

This post provided an introduction to the use of the twinkle package which should hopefully make it to CRAN from bitbucket soon. It is still in beta, and it will certainly take some time to mature, so please report bugs or feel free to contribute patches. The package departs from traditional implementation, sparse as they are, in the area of STAR models by offering extensions in the form of (MA)(X) dynamics in the conditional mean, (AR) dynamics in the conditional state equation, a mixture model for the variance, and a softmax representation for the multi-state model. It brings a complete modelling framework, developed in the rugarch package, to STAR model estimation with a set of methods which are usually lacking elsewhere. It also brings, at least for the time being, a promise of user engagement (via the R-SIG-FINANCE mailing list) and maintenance.

Download

Download and installation instructions can be found here.

References

[1] Hamilton, J. D. (1989). A new approach to the economic analysis of nonstationary time series and the business cycle. Econometrica: Journal of the Econometric Society, 357-384.

[2] Tong, H., & Lim, K. S. (1980). Threshold Autoregression, Limit Cycles and Cyclical Data. Journal of the Royal Statistical Society. Series B (Methodological), 245-292.

[3] Teräsvirta, T. (1994). Specification, estimation, and evaluation of smooth transition autoregressive models. Journal of the American Statistical association, 89(425), 208-218.

[4] Luukkonen, R., Saikkonen, P., & Teräsvirta, T. (1988). Testing linearity against smooth transition autoregressive models. Biometrika, 75(3), 491-499.

[5] Zivot, E., & Wang, J. (2007). Modeling Financial Time Series with S-PLUS® (Vol. 191). Springer.

To leave a comment for the author, please follow the link and comment on his blog: unstarched» R.

R-bloggers.com offers daily e-mail updates about R news and tutorials on topics such as: visualization (ggplot2, Boxplots, maps, animation), programming (RStudio, Sweave, LaTeX, SQL, Eclipse, git, hadoop, Web Scraping) statistics (regression, PCA, time series, trading) and more...

Shortcuts for quantmod

$
0
0

(This article was first published on Quintuitive » R, and kindly contributed to R-bloggers)

Over the years, there have been a couple of issues I have been trying to address in my daily use of this excellent package. Both are “cosmetic” improvements, they only improve the usability of the package. Let me share them and see whether they can be improved further.:)

First, let’s reduce the typing involved with getSymbols. Compare what I used to use vs what I use now:

# quantmod interface
spy = getSymbols("SPY", from="1900-01-01", src="yahoo", auto.assign=F)

# the new interface
spy = gys("spy")

Much easier to type. If you wonder, gys stands for “get Yahoo symbol”. The second improvement is transparent – instead of doing a round trip to the server (Yahoo in the above case), my new interface does some caching. It uses a well-known directory (a variable which is also part of the script or the package containing the code) and looks into the directory first. If a file for the symbol exists – no downloading. Unless it’s “forced”:

# the new interface, forcing refresh of the data
spy = gys("spy", force=T)

The complete source code is available on GitHub and contains the multi-symbol interface as well, you guessed it right – gyss.:) I have similar shortcuts for my data providers which pass me csv files. The code resides in a package, which I pretty much load on each startup (my package loads quantmod so no extra typing here;)).

To leave a comment for the author, please follow the link and comment on his blog: Quintuitive » R.

R-bloggers.com offers daily e-mail updates about R news and tutorials on topics such as: visualization (ggplot2, Boxplots, maps, animation), programming (RStudio, Sweave, LaTeX, SQL, Eclipse, git, hadoop, Web Scraping) statistics (regression, PCA, time series, trading) and more...

Twinkle,twinkle little STAR

$
0
0

(This article was first published on unstarched» R, and kindly contributed to R-bloggers)

At the recent R/Finance 2014 conference in Chicago I gave a talk on Smooth Transition AR models and a new package for estimating them called twinkle. In this blog post I will provide a short outline of the models and an introduction to the package and its features.

Financial markets have a strong cyclical component linked to the business cycle, and may undergo temporary or permanent shifts related to both endogenous and exogenous shocks. As a result, the distribution of returns is likely to be different depending on which state of the world we are in. It is therefore advantageous to model such dynamics within a framework which can accommodate and explain these different states. Within time series econometrics, the switching between states has been based either on unobserved components, giving rise to the Markov Switching (MS) models introduced by Hamilton (1989), or observed components leading to Threshold type Autoregressive (TAR) models popularized by Tong (1980). This post and the accompanying package it introduces considers only observed component switching, though there are a number of good packages in R for Markov Switching.

The Smooth Transition AR Model

The smooth transition AR model was introduced in Teräsvirta (1994), and has been used in numerous studies from GDP modelling to forex and equity market volatility. See the presentation from the talk above which includes a number of selected references.

The s-state model considered in the twinkle package takes the following form:
\[
{y_t} = \sum\limits_{i = 1}^s {\left[ {\left( {{{\phi '}_i}y_t^{\left( p \right)} + {{\xi '}_i}{x_t} + {{\psi '}_i}e_t^{\left( q \right)}} \right){F_i}\left( {{z_{t - d}};{\gamma _i},{\alpha _i},{c_i},{\beta _i}} \right)} \right]} + {\varepsilon _t}
\]
where:
\[
\begin{gathered}
y_t^{\left( p \right)} = {\left( {1,\tilde y_t^{\left( p \right)}} \right)^\prime },\quad \tilde y_t^{\left( p \right)} = {\left( {{y_{t - 1}}, \ldots ,\quad {y_{t - p}}} \right)^\prime },{\phi _i} = {\left( {{\phi _{i0}},{\phi _{i1}}, \ldots ,\quad {\phi _{ip}}} \right)^\prime } \\
\varepsilon _t^{\left( q \right)} = {\left( {{\varepsilon _{t - 1}}, \ldots ,\quad {\varepsilon _{t - q}}} \right)^\prime },{{\psi '}_i} = {\left( {{\psi _{i1}}, \ldots ,{\psi _{iq}}} \right)^\prime }\\
{x_t}{\text{ }} = {\left( {{x_1}, \ldots ,{x_l}} \right)^\prime },\quad {{\xi '}_i}{\text{ }} = {\left( {{\xi _{i1}}, \ldots ,{\xi _{il}}} \right)^\prime } \\
\end{gathered}
\]
and we allow for a variance mixture so that \( {\varepsilon _t} \sim iid\left( {0,{\sigma _i},\eta } \right) \) with \( \eta \) denoting any remaining distributional parameters which are common across states. The softmax function is used to model multiple states such that:
\[
\begin{gathered}
{F_i}\left( {{z_{t - d}};{\gamma _i},{\alpha _i},{c_i},{\beta _i}} \right) = \frac{{{e^{{\pi _{i,t}}}}}}
{{1 + \sum\limits_{i = 1}^{s - 1} {{e^{{\pi _{i,t}}}}} }} \\
{F_s}\left( {{z_{t - d}};{\gamma _i},{\alpha _i},{c_i},{\beta _i}} \right) = \frac{1}
{{1 + \sum\limits_{i = 1}^{s - 1} {{e^{{\pi _{i,t}}}}} }}\\
\end{gathered}
\]
where the state dynamics \( \pi_{i,t} \) also include the option of lag-1 autoregression:
\[
{\pi _{i,t}} = {\gamma _i}\left( {{{\alpha '}_i}{z_{t - d}} - {c_i}} \right) + {{\beta '}_i}{\pi _{i,t - 1}},\quad \gamma_i>0
\]
with initialization conditions given by:

\[\pi _{i,0} = \frac{{{\gamma _i}\left( {{{\alpha '}_i}\bar z - {c_i}} \right)}}{{1 - {\beta _i}}},\quad \left| \beta  \right| < 1\]

The parameter \( \gamma_i \) is a scaling variable determining the smoothness of the transition between states, while \( c_i \) is the threshold intercept about which switching occurs.

The transition variable(s) \( z_t \) may be a vector of external regressors each with its own lag, or a combination of lags of \( y_t \) in which case the model is ‘rudely’, as one participant in the conference noted, called ‘self-exciting’. Should \( z_t \) be a vector, then for identification purposes \( \alpha_1 \) is fixed to 1. Additionally, as will be seen later, it is also possible to pass a function \( f\left(.\right) \) which applies a custom transformation to the lagged values in the case of the self-exciting model. While it may appear at first that the same can be achieved by pre-transforming those values and passing the transformed variables in the switching equation, this leaves you dead in the water when it comes to s(w)imulation and n-ahead forecasting where the value of the transition variable depends on the lagged simulated value of that same variable.

Finally, the transition function \( F_i \) has usually been taken to be either the logistic or exponential transform functions. As the 2 figures below illustrate, the logistic nests the TAR model as \( \gamma_i\to \infty \) and collapses to the linear case as \( \gamma_i\to 0 \). The exponential on the other hand collapses to the linear case as \( \gamma_i \) approaches the limits and has a symmetric shape which is sometimes preferred for exchange rate modelling because of the perceived symmetric exchange rate adjustment behavior. Currently, only the logistic is considered in the twinkle package.

Logistic Transition

Logistic Transition

Exponential Transition

Exponential Transition


Implementation

I follow a similar construction paradigm for the twinkle package as I have in my other packages. Namely, an S4 framework which includes steps for specifying the model, estimation, inference and tests, visual diagnostics, filtering, forecasting, simulation and rolling estimation/forecasting. I consider these to be the minimum methods for creating a complete modelling environment for econometric analysis. Additional methods are summarized in the following table:

Method
Description
Class
Example
setfixed<-Set fixed parameters[1]>setfixed(spec)<-list(s1.phi0=0)
setstart<-Set starting parameters[1]>setstart(spec)<-list(s1.phi0=0)
setbounds<-Set parameter bounds[1]>setbounds(spec)<-list(s1.phi0=c(0,1))
nonlinearTestLuukkonen Test[1][2]>nonlinearTest(fit, robust=TRUE)
modelmatrixmodel matrix[1][2]>modelmatrix(fit, linear=FALSE)
coefcoef vector[2][3]>coef(fit)
fittedconditional mean[2][3][4][5][6]>fitted(fit)
residualsresiduals>residuals(fit)
statesconditional state probabilities[2][3][4][5][6]>states(fit)
likelihoodlog likelihood[2][3]>likelihood(fit)
infocriterianormalized information criteria[2][3][7]>infocriteria(fit)
vcovparameter covariance matrix[2]>vcov(fit)
convergencesolver convergence[2][7]>convergence(fit)
scorenumerical score matrix[2]>score(fit)
sigmaconditional sigma[2][3][4][5][6]>sigma(fit)
as.data.frameconditional density[7]>as.data.frame(roll)
quantileconditional quantiles[2][3][4][5][6][7]>quantile(fit)
pitconditional probability integral transformation[2][3][7]>pit(fit)
showsummary[1][2][3][4][5][6][7]>fit

The classes in column 3 are: [1] STARspec, [2] STARfit, [3] STARfilter, [4] STARforecast, [5] STARsim, [6] STARpath, [7] rollSTAR.

Model Specification

The model specification function has a number of options which I will briefly discuss in the section.

args(starspec)
#
## function (mean.model = list(states = 2, include.intercept = c(1,
##     1), arOrder = c(1, 1), maOrder = c(0, 0), matype = 'linear',
##     statevar = c('y', 's'), s = NULL, ylags = 1, statear = FALSE,
##     yfun = NULL, xreg = NULL, transform = 'logis'), variance.model = list(dynamic = FALSE,
##     model = 'sGARCH', garchOrder = c(1, 1), submodel = NULL,
##     vreg = NULL, variance.targeting = FALSE), distribution.model = 'norm',
##     start.pars = list(), fixed.pars = list(), fixed.prob = NULL,
##     ...)
##
Mean Equation

Upto 4 states may be modelled, with a choice of inclusion or exclusion of an intercept in each state (include.intercept), the number of AR (arOrder) and MA (maOrder) parameters per state and whether to include external regressors in each state (xreg should be a prelagged xts matrix). Note that the default for the moving average terms is to include them outside the states, but this can be changed by setting matype=’state’. The statevar denotes what the state variable is, with “y” being the self-exciting model and “s” a set of external regressors passed as a prelagged xts matrix to s. If the choice is “y”, the ylags should be a vector of the lags for the variable with a choice like c(1,3) denoting lag-1 and lag-3. Finally, the yfun option was discussed in the previous section and is a custom transformation function for y returning the same number of points as given.

Variance Equation

The variance can be either static (default) or dynamic (logical), in which case it can be one of 3 GARCH models (‘sGARCH’,’gjrGARCH’ or ‘eGARCH’) or ‘mixture’ as discussed previously. The rest of the options follow from those in the rugarch package in the case of GARCH type variance.

Other options

The same distributions as those in rugarch are implemented, and there is the option of passing fixed or starting parameters to the specification, although the methods ‘setfixed< -‘ and ‘setstart<-‘ allow this to be set once the specification has been formed. There is also a ‘setbounds<-‘ method for setting parameter bounds which for the unconstrained solvers (the default to use with this type of model) means using a logistic bounding transformation. Finally, the fixed.probs option allows the user to pass a set of fixed state probabilities as an xts matrix in which case the model is effectively linear and may be estimated quite easily.

Parameter naming

It is probably useful to have the naming convention of the parameters used in the package should starting, fixed or bounds need to be set. These are summarized in the list below and generally follow the notation used in the representation of the model in the previous section:

  • All state based variables are preceded by their state number (s1.,s2.,s3.,s4.)
  • Conditional Mean Equation:
    • intercept: phi0 (e.g. s1.phi0, s2.phi0)
    • AR(p): phi1, …, phip (e.g. s1.phi1, s1.phi2, s2.phi1, s2.phi2)
    • MA(q): psi1, …, psiq (e.g. s1.psi1, s1.psi2, s2.psi1, s2.psi2). Note that in the case of matype=’linear’, the states are not used.
    • X(l): xi1, …, xil (e.g. s1.xi1, s2.xi2, x3.xi1)
  • State Equation:
    • scaling variable: gamma (e.g. s1.gamma)
    • Threshold: c (e.g. s1.c)
    • Threshold Variables (k): alpha2, …, alphak (e.g. s1.alpha2, s1.alpha3). Note that the first variable (alpha1) is constrained to be 1 for identification purposes so cannot be changed. This will always show up in the summary with NAs in the standard errors since it is not estimated.
    • Threshold AR(1): beta (e.g. s1.beta)
  • Variance Equation:
    • sigma (s): If dynamic and mixture then s1.sigma, s2.sigma etc. If static then just sigma.
    • GARCH parameters follow same naming as in the rugarch package
  • Distribution:
    • skew
    • shape

I’ll define a simple specification to use with this post and based on examples from the twinkle.tests folder in the src distribution (under the inst folder). This is based on a weekly realized measure of the Nasdaq 100 index for the period 02-01-1996 to 12-10-2001, and the specification is for a simple lag-1 self-exciting model with AR(2) for each state.

require(quantmod)
data(ndx)
ndx.ret2 = ROC(Cl(ndx), na.pad = FALSE)^2
ndx.rvol = sqrt(apply.weekly(ndx.ret2, FUN = 'sum'))
colnames(ndx.rvol) = 'RVOL'
spec = starspec(mean.model = list(states = 2, arOrder = c(2, 2), statevar = 'y',
    ylags = 1))

Before proceeding, I also check the presence of STAR nonlinearity using the test of Luukkonen (1988) which is implemented in the nonlinearTest method with an option for also testing with the robust assumption (to heteroscedasticity):

tmp1 = nonlinearTest(spec, data = log(ndx.rvol))
tmp2 = nonlinearTest(spec, data = log(ndx.rvol), robust = TRUE)
testm = matrix(NA, ncol = 4, nrow = 2, dimnames = list(c('Standard', 'Robust'),
    c('F.stat', 'p.value', 'Chisq.stat', 'p.value')))
testm[1, ] = c(tmp1$F.statistic, tmp1$F.pvalue, tmp1$chisq.statistic, tmp1$chisq.pvalue)
testm[2, ] = c(tmp2$F.statistic, tmp2$F.pvalue, tmp2$chisq.statistic, tmp2$chisq.pvalue)
print(testm, digit = 5)
##
##          F.stat   p.value Chisq.stat   p.value
## Standard 3.7089 0.0014366     21.312 0.0016123
## Robust   2.5694 0.0193087     15.094 0.0195396

We can safely reject the linearity assumption under the standard test at the 1% significance level, and under the robust assumption at the 5% significance level. Note that this example is taken from the excellent book of Zivot (2007) (chapter on nonlinear models) and the numbers should also agree with what is printed there.

Model Estimation

Estimating STAR models is a challenging task, and for this purpose a number of options have been included in the package.

args(starfit)
#
## function (spec, data, out.sample = 0, solver = 'optim', solver.control = list(),
##     fit.control = list(stationarity = 0, fixed.se = 0, rec.init = 'all'),
##     cluster = NULL, n = 25, ...)
## NULL

The data must be an xts object with the same time indices as any data already passed to the STARspec object and contain only numeric data without any missing values. The out.sample is used to indicate how many data points to optionally leave out in the estimation (from the end of the dataset) for use in out-of-sample forecasting later on when the estimated object is passed to the starforecast routine. Perhaps the most important choice to be made is the type of solver to use and it’s control parameters solver.control which should not be omitted. The following solvers and ‘strategies’ are included:

  • optim. The preferred choice is the BFGS solver. The choice of solver is controlled by the method option in the solver.control list. All parameter bounds are enforced through the use of a logistic transformation.
  • nlminb. Have had little luck getting the same performance as the BFGS solver.
  • solnp. Will most likely find a local solution.
  • cmaes. Even though it is a global solver, it requires careful tweaking of the control parameters (and there are many). This is the parma package version of the solver.
  • deoptim. Another global solver. May be slow and require tweaking of the control parameters.
  • msoptim. A multistart version of optim with option for using the cluster option for parallel evaluation. The number of multi-starts is controlled by the n.restarts option in the solver.control list.
  • strategy. A special purpose optimization strategy for STAR problems using the BFGS solver. It cycles between keeping the state variables fixed and estimating the linear variables (conditional mean, variance and any distribution parameters), keeping the linear variables fixed and estimating the state variables, and a random re-start optimization to control for possibly local solutions. The argument n in the routine controls the number of times to cycle through this strategy. The solver.control list should pass control arguments for the BFGS solver. This is somewhat related to concentrating the sum of squares methodology in terms of the estimation strategy, but does not minimize the sum of squares, opting instead for a proper likelihood evaluation.

The strategy and msoptim solver strategies should be the preferred choice when estimating STARMA models.

I continue with the example already covered in the specification section and estimate the model, leaving 50 points for out of sample forecasting and filtering later on:

mod = starfit(spec, data = log(ndx.rvol), out.sample = 50, solver = 'strategy',
    n = 8, solver.control = list(alpha = 1, beta = 0.4, gamma = 1.4, reltol = 1e-12))
show(mod)
plot(mod)
#
##
## *---------------------------------*
## *          STAR Model Fit         *
## *---------------------------------*
## states       : 2
## statevar     : y
## statear      : FALSE
## variance     : static
## distribution : norm
##
##
## Optimal Parameters (Robust Standard Errors)
## ------------------------------------
##            Estimate  Std. Error    t value Pr(>|t|)
## s1.phi0    -3.54380    0.034260 -103.43760 0.000000
## s1.phi1    -0.64567    0.426487   -1.51393 0.130043
## s1.phi2     0.10950    0.319605    0.34262 0.731886
## s2.phi0    -2.51982    0.849927   -2.96475 0.003029
## s2.phi1     0.10902    0.214009    0.50944 0.610444
## s2.phi2     0.17944    0.062210    2.88447 0.003921
## s1.gamma    3.22588    1.941072    1.66190 0.096532
## s1.c       -2.52662    0.347722   -7.26620 0.000000
## s1.alpha1   1.00000          NA         NA       NA
## sigma       0.39942    0.019924   20.04776 0.000000
##
## LogLikelihood : -126.3
##
## Akaike       1.0738
## Bayes        1.1999
## Shibata      1.0714
## Hannan-Quinn 1.1246
##
## r.squared         :  0.3167
## r.squared (adj)   :  0.2913
## RSS               :  40.2
## skewness (res)    :  -0.235
## ex.kurtosis (res) :  0.4704
##
## AR roots
##         Moduli1 Moduli2
## state_1   1.274   7.170
## state_2   2.076   2.684
fitplot

plot(mod)


Model Filtering

Filtering a dataset with an already estimated set of parameters has been already extensively discussed in a related post for the rugarch package. The method takes the following arguments:

args(starfilter)
##
## function (spec, data, out.sample = 0, n.old = NULL, rec.init = 'all', ...)
##

The most important argument is probably n.old and denotes, in the case that the new dataset is composed of the old dataset (on which estimation took place) and the new data, the number of points composing the original dataset. This is so as to use the same initialization values for certain recursions and return the exact same results for those points in the original dataset. The following example illustrates:

specf = spec
setfixed(specf) < - as.list(coef(mod))
N = nrow(ndx.rvol) - 50
modf = starfilter(specf, data = log(ndx.rvol), n.old = N)
print(all.equal(fitted(modf)[1:N], fitted(mod)))
## [1] TRUE
print(all.equal(states(modf)[1:N], states(mod)))
## [1] TRUE


Model Forecasting

Nonlinear models are considerable more complex than their linear counterparts to forecast. For 1-ahead this is quite simple, but for n-ahead there is no closed form solution as in the linear case. Consider a general nonlinear first order autoregressive model:
\[
{y_t} = F\left( {{y_{t - 1}};\theta } \right) + {\varepsilon _t}
\]
The 1-step ahead forecast is simply:
\[
{{\hat y}_{t + 1\left| t \right.}} = E\left[ {{y_{t + 1}}\left| {{\Im _t}} \right.} \right] = F\left( {{y_t};\theta } \right)
\]
However, for n-step ahead, and using the Chapman-Kolmogorov relationship \( g\left( {{y_{t + h}}\left| {{\Im _t}} \right.} \right) = \int_{ – \infty }^\infty {g\left( {{y_{t + h}}\left| {{y_{t + h – 1}}} \right.} \right)g\left( {{y_{t + h – 1}}\left| {{\Im _t}} \right.} \right)d{y_{t + h – 1}}} \), we have:
\[E\left[ {{y_{t + h}}\left| {{\Im _t}} \right.} \right] = \int_{ – \infty }^\infty  {E\left[ {{y_{t + h}}\left| {{y_{t + h - 1}}} \right.} \right]g\left( {{y_{t + h – 1}}\left| {{\Im _t}} \right.} \right)d{y_{t + h – 1}}}\]
where there is no closed form relationship since \( E\left[ {F\left( . \right)} \right] \ne F\left({E\left[ . \right]} \right) \).
The trick is to start at h=2:
\[
{{\hat y}_{t + 2\left| t \right.}} = \frac{1}{T}\sum\limits_{i = 1}^T {F\left( {{{\hat y}_{t + 1\left| t \right.}} + {\varepsilon _i};\theta } \right)}
\]
and using either quadrature integration or monte carlo summation obtain the expected value. Use that value for the next step, rinse and repeat.

In the twinkle package, both quadrature and monte carlo summation are options in the starforecast method:

args(starforecast)
#
## function (fitORspec, data = NULL, n.ahead = 1, n.roll = 0, out.sample = 0,
##     external.forecasts = list(xregfor = NULL, vregfor = NULL,
##         sfor = NULL, probfor = NULL), method = c('an.parametric',
##         'an.kernel', 'mc.empirical', 'mc.parametric', 'mc.kernel'),
##     mc.sims = NULL, ...)
## NULL

with added options for either parametric, empirical or kernel fitted distribution for the residuals. The method also allows for multiple dispatch methods by taking either an object of class STARfit or one of class STARspec (with fixed parameters and a dataset). The example below illustrates the different methods:

forc1 = starforecast(mod, n.roll = 2, n.ahead = 20, method = 'an.parametric',
    mc.sims = 10000)
forc2 = starforecast(mod, n.roll = 2, n.ahead = 20, method = 'an.kernel', mc.sims = 10000)
forc3 = starforecast(mod, n.roll = 2, n.ahead = 20, method = 'mc.empirical',
    mc.sims = 10000)
forc4 = starforecast(mod, n.roll = 2, n.ahead = 20, method = 'mc.parametric',
    mc.sims = 10000)
forc5 = starforecast(mod, n.roll = 2, n.ahead = 20, method = 'mc.kernel', mc.sims = 10000)
show(forc1)
par(mfrow = c(2, 3))
plot(forc1)
plot(forc2)
plot(forc3)
plot(forc4)
plot(forc5)
#
##
## *------------------------------------*
## *        STAR Model Forecast         *
## *------------------------------------*
## Horizon        : 20
## Roll Steps     : 2
## STAR forecast  : an.parametric
## Out of Sample  : 20
##
## 0-roll forecast [T0=2000-10-27]:
##      Series
## T+1  -2.684
## T+2  -2.820
## T+3  -2.948
## T+4  -3.061
## T+5  -3.157
## T+6  -3.231
## T+7  -3.286
## T+8  -3.324
## T+9  -3.350
## T+10 -3.368
## T+11 -3.379
## T+12 -3.387
## T+13 -3.392
## T+14 -3.395
## T+15 -3.397
## T+16 -3.398
## T+17 -3.399
## T+18 -3.400
## T+19 -3.400
## T+20 -3.400

forcplot

The nice thing about the monte carlo method is that the density of each point forecast is now available, and used in the plot method to draw quantiles around that forecast. It can be extracted by looking at the slot object@forecast$yDist, which is list of length n.roll+1 of matrices of dimensions mc.sims by n.ahead.


Model Simulation

Simulation in the twinkle package, like in rugarch, can be carried out directly on the estimated STARfit object else on a specification object of class STARspec with fixed parameters. Achieving equivalence between the two relates to start-up initialization conditions and is always a good check on reproducibility and code correctness, and shown in the example that follows:

sim = starsim(mod, n.sim = 1000, rseed = 10)
path = starpath(specf, n.sim = 1000, prereturns = tail(log(ndx.rvol)[1:N], rseed = 10)
all.equal(fitted(sim), fitted(path))
## TRUE
all.equal(states(sim), states(path))
## TRUE

The fitted method extracts the simulated series as an n.sim by m.sim matrix, while the states method extracts the simulated state probabilities (optionally takes “type” argument with options for extracting the simulated raw dynamics or conditional simulated mean per state) and can be passed the argument sim to indicate which m.sim run to extract (default: 1). Passing the correct prereturns value and the same seed as in starsim, initializes the simulation from the same values as the test of equality shows between the 2 methods. Things become a little more complicated when using external regressors or GARCH dynamics, but with careful preparation the results should again be the same.

Rolling estimation and 1-step ahead forecasting

The final key modelling method, useful for backtesting, is that of the rolling estimation and 1-step ahead forecasting which has a number of options to define the type of estimation window to use as well as a resume method which re-estimates any windows which did not converge during the original run. This type of method has already been covered in related posts of rugarch so I will reserve a more in-depth demo for a later date.

Final Thoughts

This post provided an introduction to the use of the twinkle package which should hopefully make it to CRAN from bitbucket soon. It is still in beta, and it will certainly take some time to mature, so please report bugs or feel free to contribute patches. The package departs from traditional implementations, sparse as they are, in the area of STAR models by offering extensions in the form of (MA)(X) dynamics in the conditional mean, (AR) dynamics in the conditional state equation, a mixture model for the variance, and a softmax representation for the multi-state model. It brings a complete modelling framework, developed in the rugarch package, to STAR model estimation with a set of methods which are usually lacking elsewhere. It also brings, at least for the time being, a promise of user engagement (via the R-SIG-FINANCE mailing list) and maintenance.

Download

Download and installation instructions can be found here.

References

[1] Hamilton, J. D. (1989). A new approach to the economic analysis of nonstationary time series and the business cycle. Econometrica: Journal of the Econometric Society, 357-384.

[2] Tong, H., & Lim, K. S. (1980). Threshold Autoregression, Limit Cycles and Cyclical Data. Journal of the Royal Statistical Society. Series B (Methodological), 245-292.

[3] Teräsvirta, T. (1994). Specification, estimation, and evaluation of smooth transition autoregressive models. Journal of the American Statistical association, 89(425), 208-218.

[4] Luukkonen, R., Saikkonen, P., & Teräsvirta, T. (1988). Testing linearity against smooth transition autoregressive models. Biometrika, 75(3), 491-499.

[5] Zivot, E., & Wang, J. (2007). Modeling Financial Time Series with S-PLUS® (Vol. 191). Springer.

To leave a comment for the author, please follow the link and comment on his blog: unstarched» R.

R-bloggers.com offers daily e-mail updates about R news and tutorials on topics such as: visualization (ggplot2, Boxplots, maps, animation), programming (RStudio, Sweave, LaTeX, SQL, Eclipse, git, hadoop, Web Scraping) statistics (regression, PCA, time series, trading) and more...

Adjusted Momentum

$
0
0

(This article was first published on Systematic Investor » R, and kindly contributed to R-bloggers)

David Varadi has published two excellent posts / ideas about cooking with momentum:

I just could not resist the urge to share these ideas with you. Following is implementation using the Systematic Investor Toolbox.

###############################################################################
# Load Systematic Investor Toolbox (SIT)
# http://systematicinvestor.wordpress.com/systematic-investor-toolbox/
###############################################################################
setInternet2(TRUE)
con = gzcon(url('http://www.systematicportfolio.com/sit.gz', 'rb'))
    source(con)
close(con)
	#*****************************************************************
	# Load historical data
	#****************************************************************** 
	load.packages('quantmod')
		
	tickers = spl('SPY,^VIX')
		
	data <- new.env()
	getSymbols(tickers, src = 'yahoo', from = '1980-01-01', env = data, auto.assign = T)
		for(i in data$symbolnames) data[[i]] = adjustOHLC(data[[i]], use.Adjusted=T)
	bt.prep(data, align='remove.na', fill.gaps = T)

	VIX = Cl(data$VIX)
	bt.prep.remove.symbols(data, 'VIX')
	
	#*****************************************************************
	# Setup
	#*****************************************************************
	prices = data$prices
		
	models = list()

	#*****************************************************************
	# 200 SMA
	#****************************************************************** 
	data$weight[] = NA
		data$weight[] = iif(prices > SMA(prices, 200), 1, 0)
	models$ma200 = bt.run.share(data, clean.signal=T)
	
	#*****************************************************************
	# 200 ROC
	#****************************************************************** 
	roc = prices / mlag(prices) - 1
	
	data$weight[] = NA
		data$weight[] = iif(SMA(roc, 200) > 0, 1, 0)
	models$roc200 = bt.run.share(data, clean.signal=T)
	
	#*****************************************************************
	# 200 VIX MOM
	#****************************************************************** 
	data$weight[] = NA
		data$weight[] = iif(SMA(roc/VIX, 200) > 0, 1, 0)
	models$vix.mom = bt.run.share(data, clean.signal=T)

	#*****************************************************************
	# 200 ER MOM
	#****************************************************************** 
	forecast = SMA(roc,10)
	error = roc - mlag(forecast)
	mae = SMA(abs(error), 10)
	
	data$weight[] = NA
		data$weight[] = iif(SMA(roc/mae, 200) > 0, 1, 0)
	models$er.mom = bt.run.share(data, clean.signal=T)
		
	#*****************************************************************
	# Report
	#****************************************************************** 
	strategy.performance.snapshoot(models, T)

plot1

Please enjoy and share your ideas with David and myself.

To view the complete source code for this example, please have a look at the
bt.adjusted.momentum.test() function in bt.test.r at github.


To leave a comment for the author, please follow the link and comment on his blog: Systematic Investor » R.

R-bloggers.com offers daily e-mail updates about R news and tutorials on topics such as: visualization (ggplot2, Boxplots, maps, animation), programming (RStudio, Sweave, LaTeX, SQL, Eclipse, git, hadoop, Web Scraping) statistics (regression, PCA, time series, trading) and more...
Viewing all 170 articles
Browse latest View live